RBS 2013 Annual Report Download - page 435
Download and view the complete annual report
Please find page 435 of the 2013 RBS annual report below. You can navigate through the pages in the report by either clicking on the pages listed below, or by using the keyword search tool below to find specific information within the annual report.-
 1
1 -
2
-
3
-
4
-
5
-
6
-
7
-
8
-
9
-
10
-
11
-
12
-
13
-
14
-
15
-
16
-
17
-
18
-
19
-
20
-
21
-
22
-
23
-
24
-
25
-
26
-
27
-
28
-
29
-
30
-
31
-
32
-
33
-
34
-
35
-
36
-
37
-
38
-
39
-
40
-
41
-
42
-
43
-
44
-
45
-
46
-
47
-
48
-
49
-
50
-
51
-
52
-
53
-
54
-
55
-
56
-
57
-
58
-
59
-
60
-
61
-
62
-
63
-
64
-
65
-
66
-
67
-
68
-
69
-
70
-
71
-
72
-
73
-
74
-
75
-
76
-
77
-
78
-
79
-
80
-
81
-
82
-
83
-
84
-
85
-
86
-
87
-
88
-
89
-
90
-
91
-
92
-
93
-
94
-
95
-
96
-
97
-
98
-
99
-
100
-
101
-
102
-
103
-
104
-
105
-
106
-
107
-
108
-
109
-
110
-
111
-
112
-
113
-
114
-
115
-
116
-
117
-
118
-
119
-
120
-
121
-
122
-
123
-
124
-
125
-
126
-
127
-
128
-
129
-
130
-
131
-
132
-
133
-
134
-
135
-
136
-
137
-
138
-
139
-
140
-
141
-
142
-
143
-
144
-
145
-
146
-
147
-
148
-
149
-
150
-
151
-
152
-
153
-
154
-
155
-
156
-
157
-
158
-
159
-
160
-
161
-
162
-
163
-
164
-
165
-
166
-
167
-
168
-
169
-
170
-
171
-
172
-
173
-
174
-
175
-
176
-
177
-
178
-
179
-
180
-
181
-
182
-
183
-
184
-
185
-
186
-
187
-
188
-
189
-
190
-
191
-
192
-
193
-
194
-
195
-
196
-
197
-
198
-
199
-
200
-
201
-
202
-
203
-
204
-
205
-
206
-
207
-
208
-
209
-
210
-
211
-
212
-
213
-
214
-
215
-
216
-
217
-
218
-
219
-
220
-
221
-
222
-
223
-
224
-
225
-
226
-
227
-
228
-
229
-
230
-
231
-
232
-
233
-
234
-
235
-
236
-
237
-
238
-
239
-
240
-
241
-
242
-
243
-
244
-
245
-
246
-
247
-
248
-
249
-
250
-
251
-
252
-
253
-
254
-
255
-
256
-
257
-
258
-
259
-
260
-
261
-
262
-
263
-
264
-
265
-
266
-
267
-
268
-
269
-
270
-
271
-
272
-
273
-
274
-
275
-
276
-
277
-
278
-
279
-
280
-
281
-
282
-
283
-
284
-
285
-
286
-
287
-
288
-
289
-
290
-
291
-
292
-
293
-
294
-
295
-
296
-
297
-
298
-
299
-
300
-
301
-
302
-
303
-
304
-
305
-
306
-
307
-
308
-
309
-
310
-
311
-
312
-
313
-
314
-
315
-
316
-
317
-
318
-
319
-
320
-
321
-
322
-
323
-
324
-
325
-
326
-
327
-
328
-
329
-
330
-
331
-
332
-
333
-
334
-
335
-
336
-
337
-
338
-
339
-
340
-
341
-
342
-
343
-
344
-
345
-
346
-
347
-
348
-
349
-
350
-
351
-
352
-
353
-
354
-
355
-
356
-
357
-
358
-
359
-
360
-
361
-
362
-
363
-
364
-
365
-
366
-
367
-
368
-
369
-
370
-
371
-
372
-
373
-
374
-
375
-
376
-
377
-
378
-
379
-
380
-
381
-
382
-
383
-
384
-
385
-
386
-
387
-
388
-
389
-
390
-
391
-
392
-
393
-
394
-
395
-
396
-
397
-
398
-
399
-
400
-
401
-
402
-
403
-
404
-
405
-
406
-
407
-
408
-
409
-
410
-
411
-
412
-
413
-
414
-
415
-
416
-
417
-
418
-
419
-
420
-
421
-
422
-
423
-
424
-
 425
425 -
 426
426 -
 427
427 -
 428
428 -
 429
429 -
 430
430 -
 431
431 -
 432
432 -
 433
433 -
 434
434 -
 435
435 -
 436
436 -
 437
437 -
 438
438 -
 439
439 -
 440
440 -
 441
441 -
 442
442 -
 443
443 -
 444
444 -
 445
445 -
446
-
447
-
448
-
449
-
450
-
451
-
452
-
453
-
454
-
455
-
456
-
457
-
458
-
459
-
460
-
461
-
462
-
463
-
464
-
465
-
466
-
467
-
468
-
469
-
470
-
471
-
472
-
473
-
474
-
475
-
476
-
477
-
478
-
479
-
480
-
481
-
482
-
483
-
484
-
485
-
486
-
487
-
488
-
489
-
490
-
491
-
492
-
493
-
494
-
495
-
496
-
497
-
498
-
499
-
500
-
501
-
502
-
503
-
504
-
505
-
506
-
507
-
508
-
509
-
510
-
511
-
512
-
513
-
514
-
515
-
516
-
517
-
518
-
519
-
520
-
521
-
522
-
523
-
524
-
525
-
526
-
527
-
528
-
529
-
530
-
531
-
532
-
533
-
534
-
535
-
536
-
537
-
538
-
539
-
540
-
541
-
542
-
543
-
544
-
545
-
546
-
547
-
548
-
549
-
550
-
551
-
552
-
553
-
554
-
555
-
556
-
557
-
558
-
559
-
560
-
561
-
562
-
563
-
564
 |
 |

Notes on the consolidated accounts
433
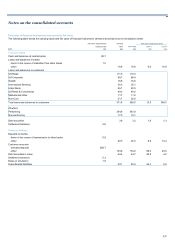
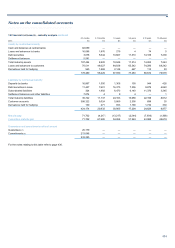
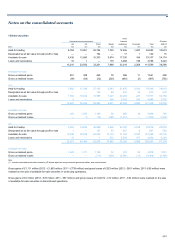
12 Financial instruments - maturity analysis
Remaining maturity
The following table shows the residual maturity of financial instruments, based on contractual date of maturity.
2013 2012 2011
Less than More than Less than More than Less than More than
12 months 12 months Total 12 months 12 months Total 12 months 12 months Total
£m £m £m £m £m £m £m £m £m
A
ssets
Cash and balances at central banks 82,659 — 82,659 79,290 — 79,290 79,269 — 79,269
Loans and advances to banks 53,206 865 54,071 63,143 808 63,951 80,905 2,405 83,310
Loans and advances to customers 169,314 271,408 440,722 197,855 302,280 500,135 197,338 318,268 515,606
Debt securities 19,542 94,057 113,599 26,363 131,075 157,438 45,311 163,769 209,080
Equity shares — 8,811 8,811 — 15,232 15,232 — 15,183 15,183
Settlement balances 5,591 — 5,591 5,741 — 5,741 7,767 4 7,771
Derivatives 45,067 242,972 288,039 51,021 390,882 441,903 60,250 469,368 529,618
Liabilities
Deposits by banks 61,108 2,871 63,979 90,704 10,701 101,405 100,499 8,305 108,804
Customer accounts 455,620 15,260 470,880 494,405 26,874 521,279 487,428 15,527 502,955
Debt securities in issue 16,547 51,272 67,819 20,296 74,296 94,592 68,889 93,732 162,621
Settlement balances and short
positions 10,490 22,845 33,335 8,573 24,896 33,469 15,248 33,268 48,516
Derivatives 45,385 240,141 285,526 51,503 382,830 434,333 61,734 462,249 523,983
Subordinated liabilities 1,350 22,662 24,012 2,351 24,422 26,773 624 25,695 26,319
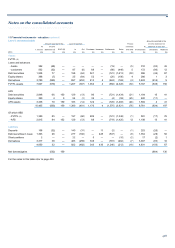
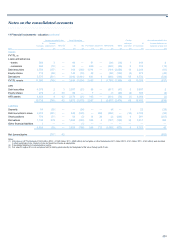
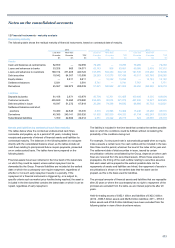
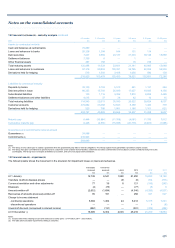
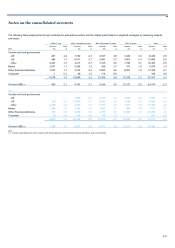
Assets and liabilities by contractual cash flow maturity
The tables below show the contractual undiscounted cash flows
receivable and payable, up to a period of 20 years, including future
receipts and payments of interest of financial assets and liabilities by
contractual maturity. The balances in the following tables do not agree
directly with the consolidated balance sheet, as the tables include all
cash flows relating to principal and future coupon payments, presented
on an undiscounted basis. The tables have been prepared on the
following basis:
Financial assets have been reflected in the time band of the latest date
on which they could be repaid, unless earlier repayment can be
demanded by the Group. Financial liabilities are included at the earliest
date on which the counterparty can require repayment, regardless of
whether or not such early repayment results in a penalty. If the
repayment of a financial instrument is triggered by, or is subject to,
specific criteria such as market price hurdles being reached, the asset is
included in the time band that contains the latest date on which it can be
repaid, regardless of early repayment.
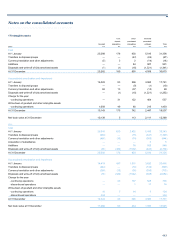
The liability is included in the time band that contains the earliest possible
date on which the conditions could be fulfilled, without considering the
probability of the conditions being met.
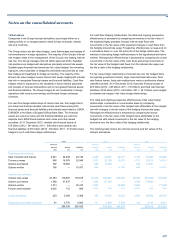
For example, if a structured note is automatically prepaid when an equity
index exceeds a certain level, the cash outflow will be included in the less
than three months period, whatever the level of the index at the year end.
The settlement date of debt securities in issue, issued by certain
securitisation vehicles consolidated by the Group, depends on when cash
flows are received from the securitised assets. Where these assets are
prepayable, the timing of the cash outflow relating to securities assumes
that each asset will be prepaid at the earliest possible date. As the
repayments of assets and liabilities are linked, the repayment of assets in
securitisations is shown on the earliest date that the asset can be
prepaid, as this is the basis used for liabilities.
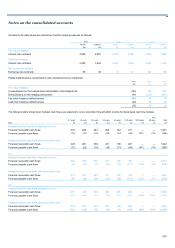
The principal amounts of financial assets and liabilities that are repayable
after 20 years or where the counterparty has no right to repayment of the
principal are excluded from the table, as are interest payments after 20
years.
Held-for-trading assets of £452.1 billion and liabilities of £423.3 billion
(2012 - £666.5 billion assets and £628.2 billion liabilities; 2011 - £763.3
billion assets and £708.0 billion liabilities) have been excluded from the
following tables in view of their short-term nature.