RBS 2013 Annual Report Download - page 264
Download and view the complete annual report
Please find page 264 of the 2013 RBS annual report below. You can navigate through the pages in the report by either clicking on the pages listed below, or by using the keyword search tool below to find specific information within the annual report.-
 1
1 -
2
-
3
-
4
-
5
-
6
-
7
-
8
-
9
-
10
-
11
-
12
-
13
-
14
-
15
-
16
-
17
-
18
-
19
-
20
-
21
-
22
-
23
-
24
-
25
-
26
-
27
-
28
-
29
-
30
-
31
-
32
-
33
-
34
-
35
-
36
-
37
-
38
-
39
-
40
-
41
-
42
-
43
-
44
-
45
-
46
-
47
-
48
-
49
-
50
-
51
-
52
-
53
-
54
-
55
-
56
-
57
-
58
-
59
-
60
-
61
-
62
-
63
-
64
-
65
-
66
-
67
-
68
-
69
-
70
-
71
-
72
-
73
-
74
-
75
-
76
-
77
-
78
-
79
-
80
-
81
-
82
-
83
-
84
-
85
-
86
-
87
-
88
-
89
-
90
-
91
-
92
-
93
-
94
-
95
-
96
-
97
-
98
-
99
-
100
-
101
-
102
-
103
-
104
-
105
-
106
-
107
-
108
-
109
-
110
-
111
-
112
-
113
-
114
-
115
-
116
-
117
-
118
-
119
-
120
-
121
-
122
-
123
-
124
-
125
-
126
-
127
-
128
-
129
-
130
-
131
-
132
-
133
-
134
-
135
-
136
-
137
-
138
-
139
-
140
-
141
-
142
-
143
-
144
-
145
-
146
-
147
-
148
-
149
-
150
-
151
-
152
-
153
-
154
-
155
-
156
-
157
-
158
-
159
-
160
-
161
-
162
-
163
-
164
-
165
-
166
-
167
-
168
-
169
-
170
-
171
-
172
-
173
-
174
-
175
-
176
-
177
-
178
-
179
-
180
-
181
-
182
-
183
-
184
-
185
-
186
-
187
-
188
-
189
-
190
-
191
-
192
-
193
-
194
-
195
-
196
-
197
-
198
-
199
-
200
-
201
-
202
-
203
-
204
-
205
-
206
-
207
-
208
-
209
-
210
-
211
-
212
-
213
-
214
-
215
-
216
-
217
-
218
-
219
-
220
-
221
-
222
-
223
-
224
-
225
-
226
-
227
-
228
-
229
-
230
-
231
-
232
-
233
-
234
-
235
-
236
-
237
-
238
-
239
-
240
-
241
-
242
-
243
-
244
-
245
-
246
-
247
-
248
-
249
-
250
-
251
-
252
-
253
-
 254
254 -
 255
255 -
 256
256 -
 257
257 -
 258
258 -
 259
259 -
 260
260 -
 261
261 -
 262
262 -
 263
263 -
 264
264 -
 265
265 -
 266
266 -
 267
267 -
 268
268 -
 269
269 -
 270
270 -
 271
271 -
 272
272 -
 273
273 -
 274
274 -
275
-
276
-
277
-
278
-
279
-
280
-
281
-
282
-
283
-
284
-
285
-
286
-
287
-
288
-
289
-
290
-
291
-
292
-
293
-
294
-
295
-
296
-
297
-
298
-
299
-
300
-
301
-
302
-
303
-
304
-
305
-
306
-
307
-
308
-
309
-
310
-
311
-
312
-
313
-
314
-
315
-
316
-
317
-
318
-
319
-
320
-
321
-
322
-
323
-
324
-
325
-
326
-
327
-
328
-
329
-
330
-
331
-
332
-
333
-
334
-
335
-
336
-
337
-
338
-
339
-
340
-
341
-
342
-
343
-
344
-
345
-
346
-
347
-
348
-
349
-
350
-
351
-
352
-
353
-
354
-
355
-
356
-
357
-
358
-
359
-
360
-
361
-
362
-
363
-
364
-
365
-
366
-
367
-
368
-
369
-
370
-
371
-
372
-
373
-
374
-
375
-
376
-
377
-
378
-
379
-
380
-
381
-
382
-
383
-
384
-
385
-
386
-
387
-
388
-
389
-
390
-
391
-
392
-
393
-
394
-
395
-
396
-
397
-
398
-
399
-
400
-
401
-
402
-
403
-
404
-
405
-
406
-
407
-
408
-
409
-
410
-
411
-
412
-
413
-
414
-
415
-
416
-
417
-
418
-
419
-
420
-
421
-
422
-
423
-
424
-
425
-
426
-
427
-
428
-
429
-
430
-
431
-
432
-
433
-
434
-
435
-
436
-
437
-
438
-
439
-
440
-
441
-
442
-
443
-
444
-
445
-
446
-
447
-
448
-
449
-
450
-
451
-
452
-
453
-
454
-
455
-
456
-
457
-
458
-
459
-
460
-
461
-
462
-
463
-
464
-
465
-
466
-
467
-
468
-
469
-
470
-
471
-
472
-
473
-
474
-
475
-
476
-
477
-
478
-
479
-
480
-
481
-
482
-
483
-
484
-
485
-
486
-
487
-
488
-
489
-
490
-
491
-
492
-
493
-
494
-
495
-
496
-
497
-
498
-
499
-
500
-
501
-
502
-
503
-
504
-
505
-
506
-
507
-
508
-
509
-
510
-
511
-
512
-
513
-
514
-
515
-
516
-
517
-
518
-
519
-
520
-
521
-
522
-
523
-
524
-
525
-
526
-
527
-
528
-
529
-
530
-
531
-
532
-
533
-
534
-
535
-
536
-
537
-
538
-
539
-
540
-
541
-
542
-
543
-
544
-
545
-
546
-
547
-
548
-
549
-
550
-
551
-
552
-
553
-
554
-
555
-
556
-
557
-
558
-
559
-
560
-
561
-
562
-
563
-
564
 |
 |

Business review Risk and balance sheet management
262
Credit risk continued
Key loan portfolios* continued
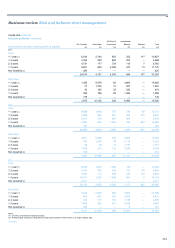
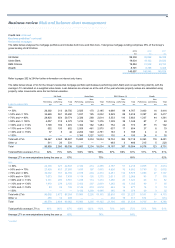
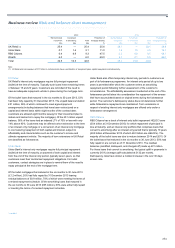
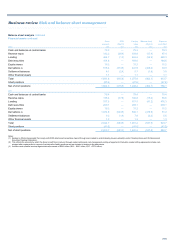
Interest only retail loans
The Group’s interest only retail loan portfolios include interest only mortgage lending in UK Retail, Ulster Bank, Wealth and RBS Citizens’ portfolios of
home equity lines of credit (HELOC) and interest only mortgage portfolios.
2013 2012
Mortgages Other loans Mortgages Other loans (1)
£bn £bn £bn £bn
Variable rate 34.8 1.3 38.5 1.5
Fixed rate 8.0 0.1 8.1 0.1
Interest only loans 42.8 1.4 46.6 1.6
Mixed repayment (2) 8.3 — 8.8 —
Total 51.1 1.4 55.4 1.6
Notes:
(1) The other loans category for 2012 has been restated to exclude non-personal interest only loans within Wealth division.
(2) Mortgages with partial interest only and partial capital repayments.
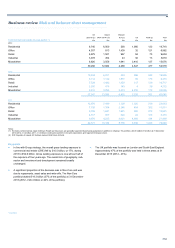
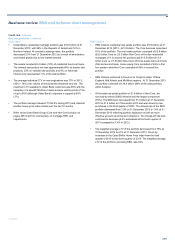
The Group reduced its exposure to interest only mortgages. UK Retail
ceased offering interest only mortgages to residential owner occupied
customers with effect from 1 December 2012. Interest only repayment
remains an option for buy-to-let mortgages. Ulster Bank withdrew interest
only as a standard mortgage offering for new lending in the Republic of
Ireland in 2010 and in Northern Ireland in 2012. Interest only mortgages
are now granted on a very limited basis to high net worth customers or as
part of its forbearance programme. RBS Citizens offers its customers
interest only mortgages and conventional HELOC that enter an
amortising repayment period after the interest only period. Wealth offers
interest only mortgages to its high net worth customers.
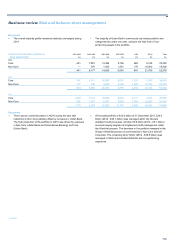
The Group recognises impairment provisions in respect of loans in its
interest only portfolios (UK Retail - 2 years; RBS Citizens - 1 year) that
are approaching their contractual maturity based on historical analysis
and customer behaviour. These impairment provisions are refreshed as
new trends and data become available.
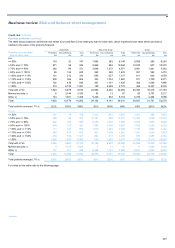
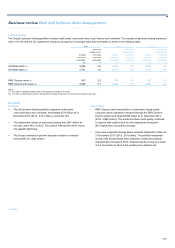
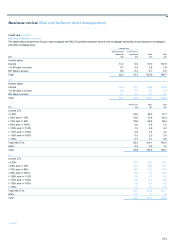
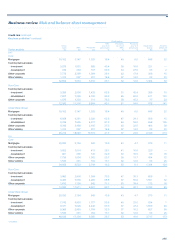
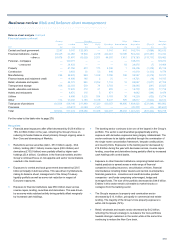
The tables below analyse the Group’s interest only mortgage and HELOC
portfolios (excluding mixed repayment mortgages) by type, by contractual
year of maturity and by originating division.
2014 (1) 2015-16 2017-21 2022-26 2027-31 2032-41 After 2041 Total
2013 £bn £bn £bn £bn £bn £bn £bn £bn
Bullet principal repayment (2) 0.9 2.1 6.0 7.6 7.9 7.5 0.5 32.5
Conversion to amortising (2,3) 1.9 6.0 2.2 0.1 — 0.1 — 10.3
Total 2.8 8.1 8.2 7.7 7.9 7.6 0.5 42.8
2013 (4) 2014-15 2016-20 2021-25 2026-30 2031-40 After 2040 Total
2012 £bn £bn £bn £bn £bn £bn £bn £bn
Bullet principal repayment (2) 1.4 2.9 6.8 5.9 8.1 9.9 0.7 35.7
Conversion to amortising (2,3) 0.5 1.7 5.8 2.7 0.1 0.1 — 10.9
Total 1.9 4.6 12.6 8.6 8.2 10.0 0.7 46.6
Notes:
(1) 2014 includes pre-2014 maturity exposure.
(2) Includes £2.3 billion (2012 - £2.2 billion) of repayment mortgages that have been granted interest only concessions (forbearance).
(3) Maturity date relates to the expiry of the interest only period.
(4) 2013 includes pre-2013 maturity exposure.
*unaudited