RBS 2013 Annual Report Download - page 403
Download and view the complete annual report
Please find page 403 of the 2013 RBS annual report below. You can navigate through the pages in the report by either clicking on the pages listed below, or by using the keyword search tool below to find specific information within the annual report.-
 1
1 -
2
-
3
-
4
-
5
-
6
-
7
-
8
-
9
-
10
-
11
-
12
-
13
-
14
-
15
-
16
-
17
-
18
-
19
-
20
-
21
-
22
-
23
-
24
-
25
-
26
-
27
-
28
-
29
-
30
-
31
-
32
-
33
-
34
-
35
-
36
-
37
-
38
-
39
-
40
-
41
-
42
-
43
-
44
-
45
-
46
-
47
-
48
-
49
-
50
-
51
-
52
-
53
-
54
-
55
-
56
-
57
-
58
-
59
-
60
-
61
-
62
-
63
-
64
-
65
-
66
-
67
-
68
-
69
-
70
-
71
-
72
-
73
-
74
-
75
-
76
-
77
-
78
-
79
-
80
-
81
-
82
-
83
-
84
-
85
-
86
-
87
-
88
-
89
-
90
-
91
-
92
-
93
-
94
-
95
-
96
-
97
-
98
-
99
-
100
-
101
-
102
-
103
-
104
-
105
-
106
-
107
-
108
-
109
-
110
-
111
-
112
-
113
-
114
-
115
-
116
-
117
-
118
-
119
-
120
-
121
-
122
-
123
-
124
-
125
-
126
-
127
-
128
-
129
-
130
-
131
-
132
-
133
-
134
-
135
-
136
-
137
-
138
-
139
-
140
-
141
-
142
-
143
-
144
-
145
-
146
-
147
-
148
-
149
-
150
-
151
-
152
-
153
-
154
-
155
-
156
-
157
-
158
-
159
-
160
-
161
-
162
-
163
-
164
-
165
-
166
-
167
-
168
-
169
-
170
-
171
-
172
-
173
-
174
-
175
-
176
-
177
-
178
-
179
-
180
-
181
-
182
-
183
-
184
-
185
-
186
-
187
-
188
-
189
-
190
-
191
-
192
-
193
-
194
-
195
-
196
-
197
-
198
-
199
-
200
-
201
-
202
-
203
-
204
-
205
-
206
-
207
-
208
-
209
-
210
-
211
-
212
-
213
-
214
-
215
-
216
-
217
-
218
-
219
-
220
-
221
-
222
-
223
-
224
-
225
-
226
-
227
-
228
-
229
-
230
-
231
-
232
-
233
-
234
-
235
-
236
-
237
-
238
-
239
-
240
-
241
-
242
-
243
-
244
-
245
-
246
-
247
-
248
-
249
-
250
-
251
-
252
-
253
-
254
-
255
-
256
-
257
-
258
-
259
-
260
-
261
-
262
-
263
-
264
-
265
-
266
-
267
-
268
-
269
-
270
-
271
-
272
-
273
-
274
-
275
-
276
-
277
-
278
-
279
-
280
-
281
-
282
-
283
-
284
-
285
-
286
-
287
-
288
-
289
-
290
-
291
-
292
-
293
-
294
-
295
-
296
-
297
-
298
-
299
-
300
-
301
-
302
-
303
-
304
-
305
-
306
-
307
-
308
-
309
-
310
-
311
-
312
-
313
-
314
-
315
-
316
-
317
-
318
-
319
-
320
-
321
-
322
-
323
-
324
-
325
-
326
-
327
-
328
-
329
-
330
-
331
-
332
-
333
-
334
-
335
-
336
-
337
-
338
-
339
-
340
-
341
-
342
-
343
-
344
-
345
-
346
-
347
-
348
-
349
-
350
-
351
-
352
-
353
-
354
-
355
-
356
-
357
-
358
-
359
-
360
-
361
-
362
-
363
-
364
-
365
-
366
-
367
-
368
-
369
-
370
-
371
-
372
-
373
-
374
-
375
-
376
-
377
-
378
-
379
-
380
-
381
-
382
-
383
-
384
-
385
-
386
-
387
-
388
-
389
-
390
-
391
-
392
-
 393
393 -
 394
394 -
 395
395 -
 396
396 -
 397
397 -
 398
398 -
 399
399 -
 400
400 -
 401
401 -
 402
402 -
 403
403 -
 404
404 -
 405
405 -
 406
406 -
 407
407 -
 408
408 -
 409
409 -
 410
410 -
 411
411 -
 412
412 -
 413
413 -
414
-
415
-
416
-
417
-
418
-
419
-
420
-
421
-
422
-
423
-
424
-
425
-
426
-
427
-
428
-
429
-
430
-
431
-
432
-
433
-
434
-
435
-
436
-
437
-
438
-
439
-
440
-
441
-
442
-
443
-
444
-
445
-
446
-
447
-
448
-
449
-
450
-
451
-
452
-
453
-
454
-
455
-
456
-
457
-
458
-
459
-
460
-
461
-
462
-
463
-
464
-
465
-
466
-
467
-
468
-
469
-
470
-
471
-
472
-
473
-
474
-
475
-
476
-
477
-
478
-
479
-
480
-
481
-
482
-
483
-
484
-
485
-
486
-
487
-
488
-
489
-
490
-
491
-
492
-
493
-
494
-
495
-
496
-
497
-
498
-
499
-
500
-
501
-
502
-
503
-
504
-
505
-
506
-
507
-
508
-
509
-
510
-
511
-
512
-
513
-
514
-
515
-
516
-
517
-
518
-
519
-
520
-
521
-
522
-
523
-
524
-
525
-
526
-
527
-
528
-
529
-
530
-
531
-
532
-
533
-
534
-
535
-
536
-
537
-
538
-
539
-
540
-
541
-
542
-
543
-
544
-
545
-
546
-
547
-
548
-
549
-
550
-
551
-
552
-
553
-
554
-
555
-
556
-
557
-
558
-
559
-
560
-
561
-
562
-
563
-
564
 |
 |

Notes on the consolidated accounts
401
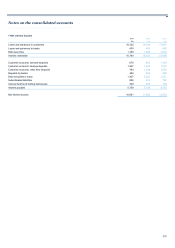
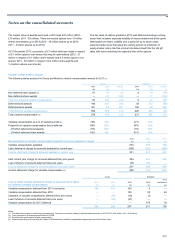
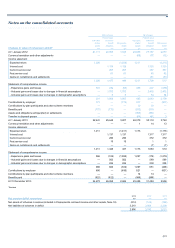
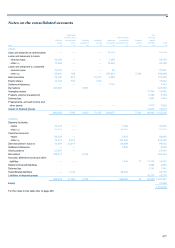
Main scheme All schemes
Present value Present value
Fair value of defined Fair value of defined
of plan benefit Net pension of plan benefit Net pension
assets obligation deficit assets obligation deficit
Changes in value of net pension deficit* £m £m £m £m £m £m
A
t 1 January 2012 21,111 22,955 1,844 25,086 27,137 2,051
Currency translation and other adjustments — — — (65) (77) (12)
Income statement
Expected return 1,028 (1,028) 1,211 (1,211)
Interest cost 1,129 1,129 1,320 1,320
Current service cost 267 267 367 367
Past service cost 81 81 82 82
Gains on curtailments and settlements — — (41) (41)
1,028 1,477 449 1,211 1,728 517
Statement of comprehensive income
- Experience gains and losses 301 232 (69) 485 207 (278)
- Actuarial gains and losses due to changes in financial assumptions — 1,750 1,750 — 2,402 2,402
- Actuarial gains and losses due to changes in demographic assumptions — 6 6 — 34 34
301 1,988 1,687 485 2,643 2,158
Contributions by employer 773 — (773) 977 — (977)
Contributions by plan participants and other scheme members — — — 10 10 —
Benefits paid (772) (772) — (910) (910) —
A
ssets and obligations extinguished on settlements — — — (360) (360) —
Transfer to disposal groups — — — (64) (61) 3
A
t 1 January 2013 22,441 25,648 3,207 26,370 30,110 3,740
Currency translation and other adjustments — — — 1 14 13
Income statement
Expected return 1,011 (1,011) 1,173 (1,173)
Interest cost 1,137 1,137 1,317 1,317
Current service cost 296 296 372 372
Past service cost 15 15 1 1
Gains on curtailments and settlements — — (7) (7)
1,011 1,448 437 1,173 1,683 510
Statement of comprehensive income
- Experience gains and losses 986 (102) (1,088) 1,097 (176) (1,273)
- Actuarial gains and losses due to changes in financial assumptions —562 562 — 589 589
- Actuarial gains and losses due to changes in demographic assumptions —224 224 — 238 238
986 684 (302) 1,097 651 (446)
Contributions by employer 656 — (656) 821 — (821)
Contributions by plan participants and other scheme members — — — 14 14 —
Benefits paid (822) (822) — (988) (988) —
A
t 31 December 2013 24,272 26,958 2,686 28,488 31,484 2,996
*Restated
2013 2012 2011
Net pension deficit comprises £m £m £m
Net assets of schemes in surplus (included in Prepayments, accrued income and other assets, Note 19) (214) (144) (188)
Net liabilities of schemes in deficit 3,210 3,884 2,239
2,996 3,740 2,051