RBS 2013 Annual Report Download - page 455
Download and view the complete annual report
Please find page 455 of the 2013 RBS annual report below. You can navigate through the pages in the report by either clicking on the pages listed below, or by using the keyword search tool below to find specific information within the annual report.-
 1
1 -
2
-
3
-
4
-
5
-
6
-
7
-
8
-
9
-
10
-
11
-
12
-
13
-
14
-
15
-
16
-
17
-
18
-
19
-
20
-
21
-
22
-
23
-
24
-
25
-
26
-
27
-
28
-
29
-
30
-
31
-
32
-
33
-
34
-
35
-
36
-
37
-
38
-
39
-
40
-
41
-
42
-
43
-
44
-
45
-
46
-
47
-
48
-
49
-
50
-
51
-
52
-
53
-
54
-
55
-
56
-
57
-
58
-
59
-
60
-
61
-
62
-
63
-
64
-
65
-
66
-
67
-
68
-
69
-
70
-
71
-
72
-
73
-
74
-
75
-
76
-
77
-
78
-
79
-
80
-
81
-
82
-
83
-
84
-
85
-
86
-
87
-
88
-
89
-
90
-
91
-
92
-
93
-
94
-
95
-
96
-
97
-
98
-
99
-
100
-
101
-
102
-
103
-
104
-
105
-
106
-
107
-
108
-
109
-
110
-
111
-
112
-
113
-
114
-
115
-
116
-
117
-
118
-
119
-
120
-
121
-
122
-
123
-
124
-
125
-
126
-
127
-
128
-
129
-
130
-
131
-
132
-
133
-
134
-
135
-
136
-
137
-
138
-
139
-
140
-
141
-
142
-
143
-
144
-
145
-
146
-
147
-
148
-
149
-
150
-
151
-
152
-
153
-
154
-
155
-
156
-
157
-
158
-
159
-
160
-
161
-
162
-
163
-
164
-
165
-
166
-
167
-
168
-
169
-
170
-
171
-
172
-
173
-
174
-
175
-
176
-
177
-
178
-
179
-
180
-
181
-
182
-
183
-
184
-
185
-
186
-
187
-
188
-
189
-
190
-
191
-
192
-
193
-
194
-
195
-
196
-
197
-
198
-
199
-
200
-
201
-
202
-
203
-
204
-
205
-
206
-
207
-
208
-
209
-
210
-
211
-
212
-
213
-
214
-
215
-
216
-
217
-
218
-
219
-
220
-
221
-
222
-
223
-
224
-
225
-
226
-
227
-
228
-
229
-
230
-
231
-
232
-
233
-
234
-
235
-
236
-
237
-
238
-
239
-
240
-
241
-
242
-
243
-
244
-
245
-
246
-
247
-
248
-
249
-
250
-
251
-
252
-
253
-
254
-
255
-
256
-
257
-
258
-
259
-
260
-
261
-
262
-
263
-
264
-
265
-
266
-
267
-
268
-
269
-
270
-
271
-
272
-
273
-
274
-
275
-
276
-
277
-
278
-
279
-
280
-
281
-
282
-
283
-
284
-
285
-
286
-
287
-
288
-
289
-
290
-
291
-
292
-
293
-
294
-
295
-
296
-
297
-
298
-
299
-
300
-
301
-
302
-
303
-
304
-
305
-
306
-
307
-
308
-
309
-
310
-
311
-
312
-
313
-
314
-
315
-
316
-
317
-
318
-
319
-
320
-
321
-
322
-
323
-
324
-
325
-
326
-
327
-
328
-
329
-
330
-
331
-
332
-
333
-
334
-
335
-
336
-
337
-
338
-
339
-
340
-
341
-
342
-
343
-
344
-
345
-
346
-
347
-
348
-
349
-
350
-
351
-
352
-
353
-
354
-
355
-
356
-
357
-
358
-
359
-
360
-
361
-
362
-
363
-
364
-
365
-
366
-
367
-
368
-
369
-
370
-
371
-
372
-
373
-
374
-
375
-
376
-
377
-
378
-
379
-
380
-
381
-
382
-
383
-
384
-
385
-
386
-
387
-
388
-
389
-
390
-
391
-
392
-
393
-
394
-
395
-
396
-
397
-
398
-
399
-
400
-
401
-
402
-
403
-
404
-
405
-
406
-
407
-
408
-
409
-
410
-
411
-
412
-
413
-
414
-
415
-
416
-
417
-
418
-
419
-
420
-
421
-
422
-
423
-
424
-
425
-
426
-
427
-
428
-
429
-
430
-
431
-
432
-
433
-
434
-
435
-
436
-
437
-
438
-
439
-
440
-
441
-
442
-
443
-
444
-
 445
445 -
 446
446 -
 447
447 -
 448
448 -
 449
449 -
 450
450 -
 451
451 -
 452
452 -
 453
453 -
 454
454 -
 455
455 -
 456
456 -
 457
457 -
 458
458 -
 459
459 -
 460
460 -
 461
461 -
 462
462 -
 463
463 -
 464
464 -
 465
465 -
466
-
467
-
468
-
469
-
470
-
471
-
472
-
473
-
474
-
475
-
476
-
477
-
478
-
479
-
480
-
481
-
482
-
483
-
484
-
485
-
486
-
487
-
488
-
489
-
490
-
491
-
492
-
493
-
494
-
495
-
496
-
497
-
498
-
499
-
500
-
501
-
502
-
503
-
504
-
505
-
506
-
507
-
508
-
509
-
510
-
511
-
512
-
513
-
514
-
515
-
516
-
517
-
518
-
519
-
520
-
521
-
522
-
523
-
524
-
525
-
526
-
527
-
528
-
529
-
530
-
531
-
532
-
533
-
534
-
535
-
536
-
537
-
538
-
539
-
540
-
541
-
542
-
543
-
544
-
545
-
546
-
547
-
548
-
549
-
550
-
551
-
552
-
553
-
554
-
555
-
556
-
557
-
558
-
559
-
560
-
561
-
562
-
563
-
564
 |
 |

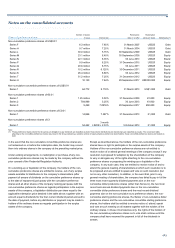
Notes on the consolidated accounts
453
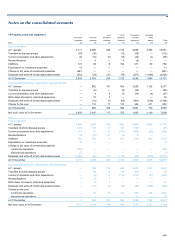
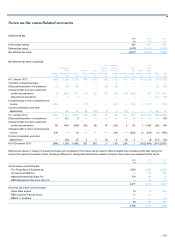
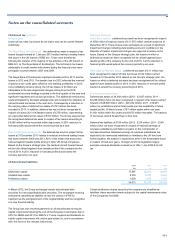
23 Deferred tax
2013 2012 2011
£m £m £m
Deferred tax liability 507 1,141 1,945
Deferred tax asset (3,478) (3,443) (3,878)
Net deferred tax asset (2,971) (2,302) (1,933)
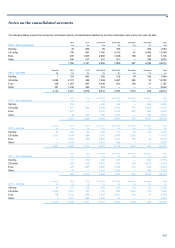
Net deferred tax asset comprised:
Fair Available- Tax
Accelerated value of for-sale Cash losses
capital Deferred IFRS financial financial flow Share carried
Pension allowances Provisions gains transition instruments assets Intangibles hedging schemes forward Other Total
£m £m £m £m £m £m £m £m £m £m £m £m £m
A
t 1 January 2012 (493) 2,306 (1,274) 359 (219) (33) (52) 252 550 (17) (3,294) (18) (1,933)
Transfers to disposal groups 1 — — — — — 2 — — — — — 3
(Disposal)/acquisition of subsidiaries (2) (38) (85) — — (6) (4) — — — — 52 (83)
Charge/(credit) to income statement
- continuing operations 43 (482) 237 (13) 84 25 (18) (15) (128) — 225 (75) (117)
- discontinued operations — 1 5 — — — — — — — — (24) (18)
(Credit)/charge to other comprehensive
income (352) — — (10) — — 200 — 155 5 (170) — (172)
Currency translation and other
adjustments — (43) 46 49 (25) 6 7(10) — — 8 (20) 18
A
t 1 January 2013 (803) 1,744 (1,071) 385 (160) (8) 135 227 577 (12) (3,231) (85) (2,302)
(Disposal)/acquisition of subsidiaries — (21) 5 — — — — — — — — — (16)
Charge/(credit) to income statement
- continuing operations 60 (445) (439) (60) 68 16 (60) 4 54 1 1,086 (89) 196
Charge/(credit) to other comprehensive
income 245 — (3) — — — (93) — (633) (1) (348) (3) (836)
Currency translation and other
adjustments — (20) 25 21 (5) 3(5) 3 — (3) (14) (13)
A
t 31 December 2013 (498) 1,258 (1,483) 327 (91) 3 (15) 226 1 (12) (2,496) (191) (2,971)
Deferred tax assets in respect of unused tax losses are recognised if the losses can be used to offset probable future taxable profits after taking into
account the expected reversal of other temporary differences. Recognised deferred tax assets in respect of tax losses are analysed further below.
2013 2012 2011
£m £m £m
UK tax losses carried forward
- The Royal Bank of Scotland plc 1,693 2,654 2,623
- UK branch of RBS N.V. — 322 166
- National Westminster Bank Plc 718 66 93
- RBS Management Services (UK) Ltd — 30 51
2,411 3,072 2,933
Overseas tax losses carried forward
- Ulster Bank Ireland 74 72 284
- RBS Citizens Financial Group 11 87 —
- RBS N.V. Australia — — 77
85 159 361
2,496 3,231 3,294