RBS 2013 Annual Report Download - page 239
Download and view the complete annual report
Please find page 239 of the 2013 RBS annual report below. You can navigate through the pages in the report by either clicking on the pages listed below, or by using the keyword search tool below to find specific information within the annual report.-
 1
1 -
2
-
3
-
4
-
5
-
6
-
7
-
8
-
9
-
10
-
11
-
12
-
13
-
14
-
15
-
16
-
17
-
18
-
19
-
20
-
21
-
22
-
23
-
24
-
25
-
26
-
27
-
28
-
29
-
30
-
31
-
32
-
33
-
34
-
35
-
36
-
37
-
38
-
39
-
40
-
41
-
42
-
43
-
44
-
45
-
46
-
47
-
48
-
49
-
50
-
51
-
52
-
53
-
54
-
55
-
56
-
57
-
58
-
59
-
60
-
61
-
62
-
63
-
64
-
65
-
66
-
67
-
68
-
69
-
70
-
71
-
72
-
73
-
74
-
75
-
76
-
77
-
78
-
79
-
80
-
81
-
82
-
83
-
84
-
85
-
86
-
87
-
88
-
89
-
90
-
91
-
92
-
93
-
94
-
95
-
96
-
97
-
98
-
99
-
100
-
101
-
102
-
103
-
104
-
105
-
106
-
107
-
108
-
109
-
110
-
111
-
112
-
113
-
114
-
115
-
116
-
117
-
118
-
119
-
120
-
121
-
122
-
123
-
124
-
125
-
126
-
127
-
128
-
129
-
130
-
131
-
132
-
133
-
134
-
135
-
136
-
137
-
138
-
139
-
140
-
141
-
142
-
143
-
144
-
145
-
146
-
147
-
148
-
149
-
150
-
151
-
152
-
153
-
154
-
155
-
156
-
157
-
158
-
159
-
160
-
161
-
162
-
163
-
164
-
165
-
166
-
167
-
168
-
169
-
170
-
171
-
172
-
173
-
174
-
175
-
176
-
177
-
178
-
179
-
180
-
181
-
182
-
183
-
184
-
185
-
186
-
187
-
188
-
189
-
190
-
191
-
192
-
193
-
194
-
195
-
196
-
197
-
198
-
199
-
200
-
201
-
202
-
203
-
204
-
205
-
206
-
207
-
208
-
209
-
210
-
211
-
212
-
213
-
214
-
215
-
216
-
217
-
218
-
219
-
220
-
221
-
222
-
223
-
224
-
225
-
226
-
227
-
228
-
 229
229 -
 230
230 -
 231
231 -
 232
232 -
 233
233 -
 234
234 -
 235
235 -
 236
236 -
 237
237 -
 238
238 -
 239
239 -
 240
240 -
 241
241 -
 242
242 -
 243
243 -
 244
244 -
 245
245 -
 246
246 -
 247
247 -
 248
248 -
 249
249 -
250
-
251
-
252
-
253
-
254
-
255
-
256
-
257
-
258
-
259
-
260
-
261
-
262
-
263
-
264
-
265
-
266
-
267
-
268
-
269
-
270
-
271
-
272
-
273
-
274
-
275
-
276
-
277
-
278
-
279
-
280
-
281
-
282
-
283
-
284
-
285
-
286
-
287
-
288
-
289
-
290
-
291
-
292
-
293
-
294
-
295
-
296
-
297
-
298
-
299
-
300
-
301
-
302
-
303
-
304
-
305
-
306
-
307
-
308
-
309
-
310
-
311
-
312
-
313
-
314
-
315
-
316
-
317
-
318
-
319
-
320
-
321
-
322
-
323
-
324
-
325
-
326
-
327
-
328
-
329
-
330
-
331
-
332
-
333
-
334
-
335
-
336
-
337
-
338
-
339
-
340
-
341
-
342
-
343
-
344
-
345
-
346
-
347
-
348
-
349
-
350
-
351
-
352
-
353
-
354
-
355
-
356
-
357
-
358
-
359
-
360
-
361
-
362
-
363
-
364
-
365
-
366
-
367
-
368
-
369
-
370
-
371
-
372
-
373
-
374
-
375
-
376
-
377
-
378
-
379
-
380
-
381
-
382
-
383
-
384
-
385
-
386
-
387
-
388
-
389
-
390
-
391
-
392
-
393
-
394
-
395
-
396
-
397
-
398
-
399
-
400
-
401
-
402
-
403
-
404
-
405
-
406
-
407
-
408
-
409
-
410
-
411
-
412
-
413
-
414
-
415
-
416
-
417
-
418
-
419
-
420
-
421
-
422
-
423
-
424
-
425
-
426
-
427
-
428
-
429
-
430
-
431
-
432
-
433
-
434
-
435
-
436
-
437
-
438
-
439
-
440
-
441
-
442
-
443
-
444
-
445
-
446
-
447
-
448
-
449
-
450
-
451
-
452
-
453
-
454
-
455
-
456
-
457
-
458
-
459
-
460
-
461
-
462
-
463
-
464
-
465
-
466
-
467
-
468
-
469
-
470
-
471
-
472
-
473
-
474
-
475
-
476
-
477
-
478
-
479
-
480
-
481
-
482
-
483
-
484
-
485
-
486
-
487
-
488
-
489
-
490
-
491
-
492
-
493
-
494
-
495
-
496
-
497
-
498
-
499
-
500
-
501
-
502
-
503
-
504
-
505
-
506
-
507
-
508
-
509
-
510
-
511
-
512
-
513
-
514
-
515
-
516
-
517
-
518
-
519
-
520
-
521
-
522
-
523
-
524
-
525
-
526
-
527
-
528
-
529
-
530
-
531
-
532
-
533
-
534
-
535
-
536
-
537
-
538
-
539
-
540
-
541
-
542
-
543
-
544
-
545
-
546
-
547
-
548
-
549
-
550
-
551
-
552
-
553
-
554
-
555
-
556
-
557
-
558
-
559
-
560
-
561
-
562
-
563
-
564
 |
 |

Business review Risk and balance sheet management
237
Key points
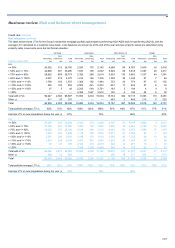
• Trends in the asset quality of the Group’s credit risk exposures
during 2013 reflected the change in the proportion of assets in the
sovereign sector and movements in the underlying asset quality of
the portfolio. The Group’s overall asset quality for performing assets
improved slightly year-on-year.
• The increase in the proportion of the Group’s Core exposures in the
AQ1 band reflected the increase in the Group’s exposure to
sovereigns, in line with the Group’s liquidity and capital management
practices.
• The increase in AQ4 was due to a positive shift in the asset quality
band distribution of UK Retail and reflected improvements in the
underlying credit quality of the UK Retail mortgage portfolio over the
last three years.
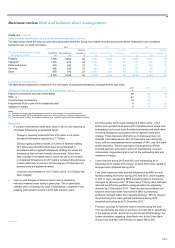
• Trends in the Group’s non-performing credit risk exposures in 2013
were predominantly driven by the Non-Core and Ulster Bank
portfolios, with these two divisions accounting for 70% of the
Group's AQ10 CRA.
• Property continued to be the largest sector in non-performing assets
- 57% of total AQ10 exposure (2012 - 58%).
• Non-performing assets in the Ulster Bank portfolio continued to
grow, driven by exposures in the wholesale property sector. Refer to
Key loan portfolios: Ulster Bank Group (Core and Non-Core) on
pages 265 to 267 for more details.
• The personal sector accounted for 21% (2012 - 21%) of the Group’s
AQ10 exposure. AQ10 exposure in this sector decreased during the
year for all divisions except Ulster Bank.
• In UK Retail non-performing assets continued to fall, principally as a
result of lower flows of assets into non-performing across all
portfolios, as well as write-downs of aged debt.
• The slight decrease in the level of AQ10 exposure in UK Corporate
was driven primarily by reductions in the property sector, offset by
increases in shipping. At the year end, shipping represented 12% of
the AQ10 assets in UK Corporate (2012 - 8%).
• Non-Core exposure fell in all AQ bands.
*unaudited
Risk mitigation
Risk mitigation techniques are used in the management of credit
portfolios across the Group, typically to mitigate credit concentrations in
relation to an individual customer, a borrower group or a collection of
related borrowers. Where possible, the Group nets customer credit
balances against obligations.
Mitigation tools applied can include: structuring a security interest in a
physical or financial asset; use of credit derivatives, including credit
default swaps, credit-linked debt instruments and securitisation
structures; and use of guarantees and similar instruments (for example,
credit insurance) from related and third parties.
When seeking to mitigate risk, at a minimum the Group considers the
following:
• The suitability of the proposed risk mitigation, particularly if
restrictions apply;
• The means by which legal certainty is to be established, including
required documentation, supportive legal opinions and the steps
needed to establish legal rights;
• Acceptable methodologies for initial and subsequent valuation of
collateral, the frequency of valuation and the advance rates given;
• The actions it can take if the value of collateral or other mitigants is
less than needed;
• The risk that the value of mitigants and counterparty credit quality
may deteriorate simultaneously;
• The need to manage concentration risks arising from collateral
types; and
• The need to ensure that any risk mitigation remains legally effective
and enforceable.
The Group’s business and credit teams are supported by specialist in-
house documentation teams. The Group uses industry-standard loan and
security documentation wherever possible. However, when the Group
uses non-standard documentation, external lawyers are employed on a
case-by-case basis.