RBS 2013 Annual Report Download - page 461
Download and view the complete annual report
Please find page 461 of the 2013 RBS annual report below. You can navigate through the pages in the report by either clicking on the pages listed below, or by using the keyword search tool below to find specific information within the annual report.-
 1
1 -
2
-
3
-
4
-
5
-
6
-
7
-
8
-
9
-
10
-
11
-
12
-
13
-
14
-
15
-
16
-
17
-
18
-
19
-
20
-
21
-
22
-
23
-
24
-
25
-
26
-
27
-
28
-
29
-
30
-
31
-
32
-
33
-
34
-
35
-
36
-
37
-
38
-
39
-
40
-
41
-
42
-
43
-
44
-
45
-
46
-
47
-
48
-
49
-
50
-
51
-
52
-
53
-
54
-
55
-
56
-
57
-
58
-
59
-
60
-
61
-
62
-
63
-
64
-
65
-
66
-
67
-
68
-
69
-
70
-
71
-
72
-
73
-
74
-
75
-
76
-
77
-
78
-
79
-
80
-
81
-
82
-
83
-
84
-
85
-
86
-
87
-
88
-
89
-
90
-
91
-
92
-
93
-
94
-
95
-
96
-
97
-
98
-
99
-
100
-
101
-
102
-
103
-
104
-
105
-
106
-
107
-
108
-
109
-
110
-
111
-
112
-
113
-
114
-
115
-
116
-
117
-
118
-
119
-
120
-
121
-
122
-
123
-
124
-
125
-
126
-
127
-
128
-
129
-
130
-
131
-
132
-
133
-
134
-
135
-
136
-
137
-
138
-
139
-
140
-
141
-
142
-
143
-
144
-
145
-
146
-
147
-
148
-
149
-
150
-
151
-
152
-
153
-
154
-
155
-
156
-
157
-
158
-
159
-
160
-
161
-
162
-
163
-
164
-
165
-
166
-
167
-
168
-
169
-
170
-
171
-
172
-
173
-
174
-
175
-
176
-
177
-
178
-
179
-
180
-
181
-
182
-
183
-
184
-
185
-
186
-
187
-
188
-
189
-
190
-
191
-
192
-
193
-
194
-
195
-
196
-
197
-
198
-
199
-
200
-
201
-
202
-
203
-
204
-
205
-
206
-
207
-
208
-
209
-
210
-
211
-
212
-
213
-
214
-
215
-
216
-
217
-
218
-
219
-
220
-
221
-
222
-
223
-
224
-
225
-
226
-
227
-
228
-
229
-
230
-
231
-
232
-
233
-
234
-
235
-
236
-
237
-
238
-
239
-
240
-
241
-
242
-
243
-
244
-
245
-
246
-
247
-
248
-
249
-
250
-
251
-
252
-
253
-
254
-
255
-
256
-
257
-
258
-
259
-
260
-
261
-
262
-
263
-
264
-
265
-
266
-
267
-
268
-
269
-
270
-
271
-
272
-
273
-
274
-
275
-
276
-
277
-
278
-
279
-
280
-
281
-
282
-
283
-
284
-
285
-
286
-
287
-
288
-
289
-
290
-
291
-
292
-
293
-
294
-
295
-
296
-
297
-
298
-
299
-
300
-
301
-
302
-
303
-
304
-
305
-
306
-
307
-
308
-
309
-
310
-
311
-
312
-
313
-
314
-
315
-
316
-
317
-
318
-
319
-
320
-
321
-
322
-
323
-
324
-
325
-
326
-
327
-
328
-
329
-
330
-
331
-
332
-
333
-
334
-
335
-
336
-
337
-
338
-
339
-
340
-
341
-
342
-
343
-
344
-
345
-
346
-
347
-
348
-
349
-
350
-
351
-
352
-
353
-
354
-
355
-
356
-
357
-
358
-
359
-
360
-
361
-
362
-
363
-
364
-
365
-
366
-
367
-
368
-
369
-
370
-
371
-
372
-
373
-
374
-
375
-
376
-
377
-
378
-
379
-
380
-
381
-
382
-
383
-
384
-
385
-
386
-
387
-
388
-
389
-
390
-
391
-
392
-
393
-
394
-
395
-
396
-
397
-
398
-
399
-
400
-
401
-
402
-
403
-
404
-
405
-
406
-
407
-
408
-
409
-
410
-
411
-
412
-
413
-
414
-
415
-
416
-
417
-
418
-
419
-
420
-
421
-
422
-
423
-
424
-
425
-
426
-
427
-
428
-
429
-
430
-
431
-
432
-
433
-
434
-
435
-
436
-
437
-
438
-
439
-
440
-
441
-
442
-
443
-
444
-
445
-
446
-
447
-
448
-
449
-
450
-
 451
451 -
 452
452 -
 453
453 -
 454
454 -
 455
455 -
 456
456 -
 457
457 -
 458
458 -
 459
459 -
 460
460 -
 461
461 -
 462
462 -
 463
463 -
 464
464 -
 465
465 -
 466
466 -
 467
467 -
 468
468 -
 469
469 -
 470
470 -
 471
471 -
472
-
473
-
474
-
475
-
476
-
477
-
478
-
479
-
480
-
481
-
482
-
483
-
484
-
485
-
486
-
487
-
488
-
489
-
490
-
491
-
492
-
493
-
494
-
495
-
496
-
497
-
498
-
499
-
500
-
501
-
502
-
503
-
504
-
505
-
506
-
507
-
508
-
509
-
510
-
511
-
512
-
513
-
514
-
515
-
516
-
517
-
518
-
519
-
520
-
521
-
522
-
523
-
524
-
525
-
526
-
527
-
528
-
529
-
530
-
531
-
532
-
533
-
534
-
535
-
536
-
537
-
538
-
539
-
540
-
541
-
542
-
543
-
544
-
545
-
546
-
547
-
548
-
549
-
550
-
551
-
552
-
553
-
554
-
555
-
556
-
557
-
558
-
559
-
560
-
561
-
562
-
563
-
564
 |
 |

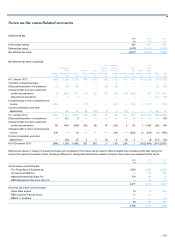
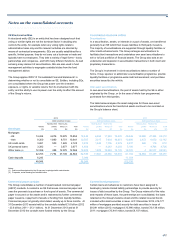
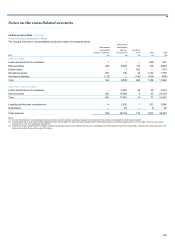
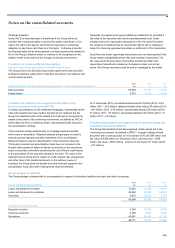
Notes on the consolidated accounts
459
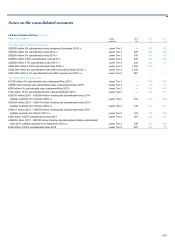
Undated loan capital
Capital 2013 2012 2011
treatment £m £m £m
The Royal Bank of Scotland Group plc
€
391 million floating rate 2042 (callable quarterly from June 2012) (2,3) Tier 1 326 319 340
US$486 million 6.8% 2042 (callable quarterly from March 2008) (2,4) Tier 1 294 302 309
US$318 million floating rate (callable quarterly from July 2013) (2,5) Tier 1 192 199 210
US$394 million 6.425% 2043 (callable quarterly from January 2034) (2,6) Tier 1 301 365 382
US$106 million undated floating rate primary capital notes
(callable semi-annually from December 1990) (1) Upper Tier 2 65 66 69
US$762 million 7.648% perpetual regulatory (callable quarterly from September 2031) (8) Tier 1 465 477 497
The Royal Bank of Scotland plc
£31 million 4.956% undated subordinated notes Upper Tier 2 31 31 31
£51 million 6.25% undated subordinated notes (callable every five years from December 2012) Upper Tier 2 50 51 53
£56 million 6% undated subordinated notes (callable every five years from September 2014) Upper Tier 2 59 61 62
€
176 million 5.125% undated subordinated notes (callable quarterly from July 2014) Upper Tier 2 153 155 161
€
170 million floating rate undated subordinated notes (callable quarterly from July 2014) Upper Tier 2 141 138 141
£54 million 5.125% undated subordinated notes (callable every five years from March 2016) Upper Tier 2 60 61 61
£35 million 5.5% undated subordinated notes (callable every five years from December 2019) Upper Tier 2 39 39 37
£21 million 6.2% undated subordinated notes (callable every five years from March 2022) Upper Tier 2 26 46 45
£103 million 9.5% undated subordinated bonds (callable every five years from August 2018) (3) Upper Tier 2 127 137 137
£16 million (2011 - £22 million) 5.625% undated subordinated notes
(callable every five years from September 2026) Upper Tier 2 24 24 23
£19 million 5.625% undated subordinated notes (callable every five years from June 2032) Upper Tier 2 21 13 13
£1 million floating rate undated subordinated notes (callable semi-annually from March 2011) Upper Tier 2 11 1
CAD474 million 5.37% undated subordinated notes (callable quarterly from May 2016) Upper Tier 2 291 328 347
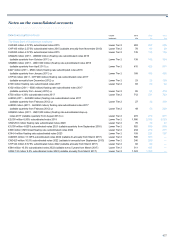
National Westminster Bank Plc
US$193 million primary capital floating rate notes, Series A (callable semi-annually from July 1990) Upper Tier 2 117 119 124
US$229 million primary capital floating rate notes, Series B (callable semi-annually from August 1990) Upper Tier 2 139 142 148
US$285 million primary capital floating rate notes, Series C (callable quarterly from November 1990) Upper Tier 2 173 177 184
€
178 million floating rate undated subordinated notes (callable quarterly from October 2009) Upper Tier 2 149 146 150
€
10 million floating rate undated step-up notes (callable quarterly from October 2009) Upper Tier 2 99 9
£87 million floating undated subordinated step-up notes (callable every five years from January 2010) Upper Tier 2 92 92 91
£53 million 7.125% undated subordinated step-up notes (callable every five years from October 2022) Upper Tier 2 54 55 56
£35 million 11.5% undated subordinated notes (callable any time from December 2022) (1,9) Upper Tier 2 35 38 42
First Active plc
£20 million 11.75% perpetual Lower Tier 2 25 25 26
€
38 million 11.375% perpetual Lower Tier 2 52 46 48
£1.3 million floating rate perpetual Lower Tier 2 12 2
RBS NV and subsidiaries
US$1,285 million 6.025% 2049 (callable any time from July 2008) (2,7,10) Tier 1 730 713 684
US$200 million 6.375% 2033 (callable any time from September 2008) (2,7,11) Tier 1 114 112 108
US$1,800 million 6.2% 2033 (callable any time from February 2009) (2,7,12) Tier 1 1,020 999 958
5,376 5,488 5,549
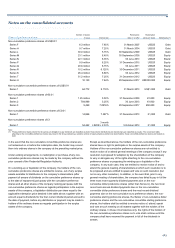
For the notes to this table refer to the following page.