RBS 2013 Annual Report Download - page 449
Download and view the complete annual report
Please find page 449 of the 2013 RBS annual report below. You can navigate through the pages in the report by either clicking on the pages listed below, or by using the keyword search tool below to find specific information within the annual report.-
 1
1 -
2
-
3
-
4
-
5
-
6
-
7
-
8
-
9
-
10
-
11
-
12
-
13
-
14
-
15
-
16
-
17
-
18
-
19
-
20
-
21
-
22
-
23
-
24
-
25
-
26
-
27
-
28
-
29
-
30
-
31
-
32
-
33
-
34
-
35
-
36
-
37
-
38
-
39
-
40
-
41
-
42
-
43
-
44
-
45
-
46
-
47
-
48
-
49
-
50
-
51
-
52
-
53
-
54
-
55
-
56
-
57
-
58
-
59
-
60
-
61
-
62
-
63
-
64
-
65
-
66
-
67
-
68
-
69
-
70
-
71
-
72
-
73
-
74
-
75
-
76
-
77
-
78
-
79
-
80
-
81
-
82
-
83
-
84
-
85
-
86
-
87
-
88
-
89
-
90
-
91
-
92
-
93
-
94
-
95
-
96
-
97
-
98
-
99
-
100
-
101
-
102
-
103
-
104
-
105
-
106
-
107
-
108
-
109
-
110
-
111
-
112
-
113
-
114
-
115
-
116
-
117
-
118
-
119
-
120
-
121
-
122
-
123
-
124
-
125
-
126
-
127
-
128
-
129
-
130
-
131
-
132
-
133
-
134
-
135
-
136
-
137
-
138
-
139
-
140
-
141
-
142
-
143
-
144
-
145
-
146
-
147
-
148
-
149
-
150
-
151
-
152
-
153
-
154
-
155
-
156
-
157
-
158
-
159
-
160
-
161
-
162
-
163
-
164
-
165
-
166
-
167
-
168
-
169
-
170
-
171
-
172
-
173
-
174
-
175
-
176
-
177
-
178
-
179
-
180
-
181
-
182
-
183
-
184
-
185
-
186
-
187
-
188
-
189
-
190
-
191
-
192
-
193
-
194
-
195
-
196
-
197
-
198
-
199
-
200
-
201
-
202
-
203
-
204
-
205
-
206
-
207
-
208
-
209
-
210
-
211
-
212
-
213
-
214
-
215
-
216
-
217
-
218
-
219
-
220
-
221
-
222
-
223
-
224
-
225
-
226
-
227
-
228
-
229
-
230
-
231
-
232
-
233
-
234
-
235
-
236
-
237
-
238
-
239
-
240
-
241
-
242
-
243
-
244
-
245
-
246
-
247
-
248
-
249
-
250
-
251
-
252
-
253
-
254
-
255
-
256
-
257
-
258
-
259
-
260
-
261
-
262
-
263
-
264
-
265
-
266
-
267
-
268
-
269
-
270
-
271
-
272
-
273
-
274
-
275
-
276
-
277
-
278
-
279
-
280
-
281
-
282
-
283
-
284
-
285
-
286
-
287
-
288
-
289
-
290
-
291
-
292
-
293
-
294
-
295
-
296
-
297
-
298
-
299
-
300
-
301
-
302
-
303
-
304
-
305
-
306
-
307
-
308
-
309
-
310
-
311
-
312
-
313
-
314
-
315
-
316
-
317
-
318
-
319
-
320
-
321
-
322
-
323
-
324
-
325
-
326
-
327
-
328
-
329
-
330
-
331
-
332
-
333
-
334
-
335
-
336
-
337
-
338
-
339
-
340
-
341
-
342
-
343
-
344
-
345
-
346
-
347
-
348
-
349
-
350
-
351
-
352
-
353
-
354
-
355
-
356
-
357
-
358
-
359
-
360
-
361
-
362
-
363
-
364
-
365
-
366
-
367
-
368
-
369
-
370
-
371
-
372
-
373
-
374
-
375
-
376
-
377
-
378
-
379
-
380
-
381
-
382
-
383
-
384
-
385
-
386
-
387
-
388
-
389
-
390
-
391
-
392
-
393
-
394
-
395
-
396
-
397
-
398
-
399
-
400
-
401
-
402
-
403
-
404
-
405
-
406
-
407
-
408
-
409
-
410
-
411
-
412
-
413
-
414
-
415
-
416
-
417
-
418
-
419
-
420
-
421
-
422
-
423
-
424
-
425
-
426
-
427
-
428
-
429
-
430
-
431
-
432
-
433
-
434
-
435
-
436
-
437
-
438
-
 439
439 -
 440
440 -
 441
441 -
 442
442 -
 443
443 -
 444
444 -
 445
445 -
 446
446 -
 447
447 -
 448
448 -
 449
449 -
 450
450 -
 451
451 -
 452
452 -
 453
453 -
 454
454 -
 455
455 -
 456
456 -
 457
457 -
 458
458 -
 459
459 -
460
-
461
-
462
-
463
-
464
-
465
-
466
-
467
-
468
-
469
-
470
-
471
-
472
-
473
-
474
-
475
-
476
-
477
-
478
-
479
-
480
-
481
-
482
-
483
-
484
-
485
-
486
-
487
-
488
-
489
-
490
-
491
-
492
-
493
-
494
-
495
-
496
-
497
-
498
-
499
-
500
-
501
-
502
-
503
-
504
-
505
-
506
-
507
-
508
-
509
-
510
-
511
-
512
-
513
-
514
-
515
-
516
-
517
-
518
-
519
-
520
-
521
-
522
-
523
-
524
-
525
-
526
-
527
-
528
-
529
-
530
-
531
-
532
-
533
-
534
-
535
-
536
-
537
-
538
-
539
-
540
-
541
-
542
-
543
-
544
-
545
-
546
-
547
-
548
-
549
-
550
-
551
-
552
-
553
-
554
-
555
-
556
-
557
-
558
-
559
-
560
-
561
-
562
-
563
-
564
 |
 |

Notes on the consolidated accounts
447
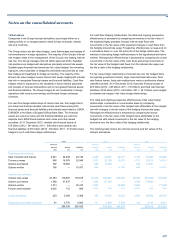
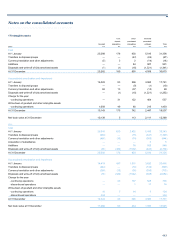
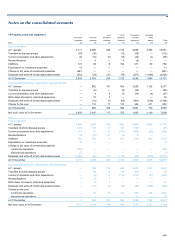
Long Short Computers Operating
Investment Freehold leasehold leasehold and othe
r
lease
properties premises premises premises equipment assets Total
2011 £m £m £m £m £m £m £m
Cost or valuation
A
t 1 January 4,170 2,938 291 1,832 4,239 9,235 22,705
Transfers to disposal groups — (107) (12) (93) (49) (5,355) (5,616)
Currency translation and other adjustments (103) 2 (4) (6) (77) 3 (185)
Reclassifications 57 8 (38) (35) 8 — —
A
dditions 1,262 68 46 174 532 1,384 3,466
Expenditure on investment properties 14 — — — — — 14
Change in fair value of investment properties
- continuing operations (139) — — — — — (139)
Disposals and write-off of fully depreciated assets (793) (54) (10) (49) (174) (1,375) (2,455)
A
t 31 Decembe
r
4,468 2,855 273 1,823 4,479 3,892 17,790
A
ccumulated impairment, depreciation and amortisation
A
t 1 January — 702 118 793 2,700 1,849 6,162
Transfers to disposal groups — (43) (6) (66) (26) (730) (871)
Currency translation and other adjustments — 6 4 (1) (28) 15 (4)
Reclassifications — 3 (9) 7 — (1) —
Write down of property, plant and equipment — — 3 1 1 — 5
Disposals and write-off of fully depreciated assets — (29) — (32) (110) (466) (637)
Charge for the year
- continuing operations — 95 4 148 487 520 1,254
- discontinued operations — 2 — — 11 — 13
A
t 31 December — 736 114 850 3,035 1,187 5,922
Net book value at 31 December 4,468 2,119 159 973 1,444 2,705 11,868
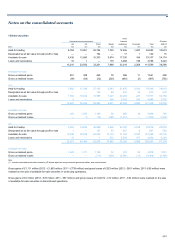
Investment property valuations principally employ present value
techniques that discount expected cash flows. Expected cash flows
reflect rental income, occupancy and residual market values; valuations
are sensitive to changes in these factors. The fair value measurement of
non-specialised properties in locations where the market for such
properties is active and transparent are categorised as level 2 (46%);
otherwise investment property fair value measurements are categorised
as level 3 (54%).
Valuations were carried out by qualified surveyors who are members of
the Royal Institution of Chartered Surveyors, or an equivalent overseas
body; property with a fair value of £985 million was valued by
independent valuers.
The fair value of investment properties includes £271 million of
depreciation since purchase (2012 - £186 million; 2011 - £146 million).
Rental income from investment properties was £244 million (2012 - £267
million; 2011 - £270 million). Direct operating expenses of investment
properties were £91 million (2012 - £125 million; 2011 - £110 million).
Property, plant and equipment, excluding investment properties, include
£42 million (2012 - £35 million; 2011 - £186 million) assets in the course
of construction.
19 Prepayments, accrued income and other assets
2013 2012 2011
£m £m £m
Prepayments 612 904 1,123
A
ccrued income 530 526 672
Deferred expenses 42 57 502
Pension schemes in net surplus (see Note 4) 214 144 188
Interests in associates 902 776 344
Other assets 5,314 5,413 8,147
7,614 7,820 10,976