RBS 2013 Annual Report Download - page 338
Download and view the complete annual report
Please find page 338 of the 2013 RBS annual report below. You can navigate through the pages in the report by either clicking on the pages listed below, or by using the keyword search tool below to find specific information within the annual report.-
 1
1 -
2
-
3
-
4
-
5
-
6
-
7
-
8
-
9
-
10
-
11
-
12
-
13
-
14
-
15
-
16
-
17
-
18
-
19
-
20
-
21
-
22
-
23
-
24
-
25
-
26
-
27
-
28
-
29
-
30
-
31
-
32
-
33
-
34
-
35
-
36
-
37
-
38
-
39
-
40
-
41
-
42
-
43
-
44
-
45
-
46
-
47
-
48
-
49
-
50
-
51
-
52
-
53
-
54
-
55
-
56
-
57
-
58
-
59
-
60
-
61
-
62
-
63
-
64
-
65
-
66
-
67
-
68
-
69
-
70
-
71
-
72
-
73
-
74
-
75
-
76
-
77
-
78
-
79
-
80
-
81
-
82
-
83
-
84
-
85
-
86
-
87
-
88
-
89
-
90
-
91
-
92
-
93
-
94
-
95
-
96
-
97
-
98
-
99
-
100
-
101
-
102
-
103
-
104
-
105
-
106
-
107
-
108
-
109
-
110
-
111
-
112
-
113
-
114
-
115
-
116
-
117
-
118
-
119
-
120
-
121
-
122
-
123
-
124
-
125
-
126
-
127
-
128
-
129
-
130
-
131
-
132
-
133
-
134
-
135
-
136
-
137
-
138
-
139
-
140
-
141
-
142
-
143
-
144
-
145
-
146
-
147
-
148
-
149
-
150
-
151
-
152
-
153
-
154
-
155
-
156
-
157
-
158
-
159
-
160
-
161
-
162
-
163
-
164
-
165
-
166
-
167
-
168
-
169
-
170
-
171
-
172
-
173
-
174
-
175
-
176
-
177
-
178
-
179
-
180
-
181
-
182
-
183
-
184
-
185
-
186
-
187
-
188
-
189
-
190
-
191
-
192
-
193
-
194
-
195
-
196
-
197
-
198
-
199
-
200
-
201
-
202
-
203
-
204
-
205
-
206
-
207
-
208
-
209
-
210
-
211
-
212
-
213
-
214
-
215
-
216
-
217
-
218
-
219
-
220
-
221
-
222
-
223
-
224
-
225
-
226
-
227
-
228
-
229
-
230
-
231
-
232
-
233
-
234
-
235
-
236
-
237
-
238
-
239
-
240
-
241
-
242
-
243
-
244
-
245
-
246
-
247
-
248
-
249
-
250
-
251
-
252
-
253
-
254
-
255
-
256
-
257
-
258
-
259
-
260
-
261
-
262
-
263
-
264
-
265
-
266
-
267
-
268
-
269
-
270
-
271
-
272
-
273
-
274
-
275
-
276
-
277
-
278
-
279
-
280
-
281
-
282
-
283
-
284
-
285
-
286
-
287
-
288
-
289
-
290
-
291
-
292
-
293
-
294
-
295
-
296
-
297
-
298
-
299
-
300
-
301
-
302
-
303
-
304
-
305
-
306
-
307
-
308
-
309
-
310
-
311
-
312
-
313
-
314
-
315
-
316
-
317
-
318
-
319
-
320
-
321
-
322
-
323
-
324
-
325
-
326
-
327
-
 328
328 -
 329
329 -
 330
330 -
 331
331 -
 332
332 -
 333
333 -
 334
334 -
 335
335 -
 336
336 -
 337
337 -
 338
338 -
 339
339 -
 340
340 -
 341
341 -
 342
342 -
 343
343 -
 344
344 -
 345
345 -
 346
346 -
 347
347 -
 348
348 -
349
-
350
-
351
-
352
-
353
-
354
-
355
-
356
-
357
-
358
-
359
-
360
-
361
-
362
-
363
-
364
-
365
-
366
-
367
-
368
-
369
-
370
-
371
-
372
-
373
-
374
-
375
-
376
-
377
-
378
-
379
-
380
-
381
-
382
-
383
-
384
-
385
-
386
-
387
-
388
-
389
-
390
-
391
-
392
-
393
-
394
-
395
-
396
-
397
-
398
-
399
-
400
-
401
-
402
-
403
-
404
-
405
-
406
-
407
-
408
-
409
-
410
-
411
-
412
-
413
-
414
-
415
-
416
-
417
-
418
-
419
-
420
-
421
-
422
-
423
-
424
-
425
-
426
-
427
-
428
-
429
-
430
-
431
-
432
-
433
-
434
-
435
-
436
-
437
-
438
-
439
-
440
-
441
-
442
-
443
-
444
-
445
-
446
-
447
-
448
-
449
-
450
-
451
-
452
-
453
-
454
-
455
-
456
-
457
-
458
-
459
-
460
-
461
-
462
-
463
-
464
-
465
-
466
-
467
-
468
-
469
-
470
-
471
-
472
-
473
-
474
-
475
-
476
-
477
-
478
-
479
-
480
-
481
-
482
-
483
-
484
-
485
-
486
-
487
-
488
-
489
-
490
-
491
-
492
-
493
-
494
-
495
-
496
-
497
-
498
-
499
-
500
-
501
-
502
-
503
-
504
-
505
-
506
-
507
-
508
-
509
-
510
-
511
-
512
-
513
-
514
-
515
-
516
-
517
-
518
-
519
-
520
-
521
-
522
-
523
-
524
-
525
-
526
-
527
-
528
-
529
-
530
-
531
-
532
-
533
-
534
-
535
-
536
-
537
-
538
-
539
-
540
-
541
-
542
-
543
-
544
-
545
-
546
-
547
-
548
-
549
-
550
-
551
-
552
-
553
-
554
-
555
-
556
-
557
-
558
-
559
-
560
-
561
-
562
-
563
-
564
 |
 |

Business review Risk and balance sheet management
336
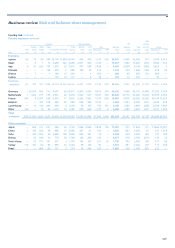
Market risk continued
Non-traded market risk continued
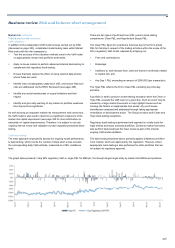
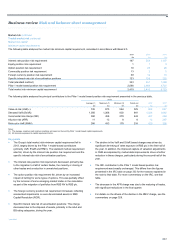
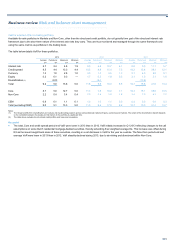
The following table shows the sensitivity of net interest income, over the
next 12 months, to an immediate upward or downward change of 100
basis points to all interest rates. In addition, the table includes the impact
of a gradual 400 basis point steepening (bear steepener) and a gradual
300 basis point flattening (bull flattener) of the yield curve for tenors
greater than a year.
The scenarios represent annualised interest rate stresses of a scale
deemed sufficient to trigger a modification in customer behaviour. The
asymmetry in the steepening and flattening scenarios reflects the
difference in the expected behaviour of interest rates as they approach
zero.
The reported sensitivities will vary over time due to a number of factors
such as market conditions and strategic changes to the balance sheet
mix and should not therefore be considered predictive of future
performance.
Euro Sterling US dolla
r
Othe
r
Total
2013 £m £m £m £m £m
+ 100 basis point shift in yield curves 59 416 175 31 681
− 100 basis point shift in yield curves (29) (333) (82) (15) (459)
Bear steepener 403
Bull flattener (273)
2012
+ 100 basis point shift in yield curves (29) 472 119 27 589
− 100 basis point shift in yield curves (20) (257) (29) (11) (317)
Bear steepener 216
Bull flattener (77)
2011
+ 100 basis point shift in yield curves (19) 190 59 14 244
− 100 basis point shift in yield curves 25 (188) (4) (16) (183)
Bear steepener 443
Bull flattener (146)
Key points
• The Group's interest rate exposure remains asset sensitive, such
that rising rates will have a positive impact on its net interest income.
• The Group’s increased sensitivity to parallel shifts in the yield curve
over a 12 month horizon primarily reflects the higher volume of
structural hedges maturing in 2014 relative to 2013. This reflects the
maturity profile of legacy hedges. If rates were to rise, these would
be reinvested at higher rates, with an upward impact on net interest
income. This increased sensitivity also reflects changes in
underlying pricing assumptions for customer loans and deposits.
• The increased sensitivity to the steepening and flattening scenarios
is also primarily driven by the maturity profile of structural hedges.
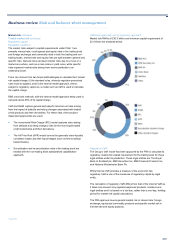
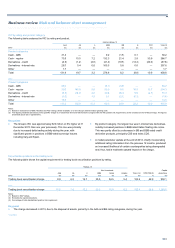
Structural hedging*
Banks generally have the benefit of a significant pool of stable, non and
low interest bearing liabilities, principally comprising equity and money
transmission accounts. These balances are usually hedged, either by
investing directly in longer-term fixed rate assets or by the use of interest
rate swaps, in order to provide a consistent and predictable revenue
stream.
The Group targets a weighted average life for these economic hedges.
This is accomplished using a continuous rolling maturity programme to
achieve the desired profile and is primarily managed by Group Treasury.
The maturity profile of the hedge aims to reduce the potential sensitivity
of income to rate movements. The structural hedging programme is
Group wide, capturing the position within the UK banking group and
regulated subsidiaries in other jurisdictions.