RBS 2013 Annual Report Download - page 428
Download and view the complete annual report
Please find page 428 of the 2013 RBS annual report below. You can navigate through the pages in the report by either clicking on the pages listed below, or by using the keyword search tool below to find specific information within the annual report.-
 1
1 -
2
-
3
-
4
-
5
-
6
-
7
-
8
-
9
-
10
-
11
-
12
-
13
-
14
-
15
-
16
-
17
-
18
-
19
-
20
-
21
-
22
-
23
-
24
-
25
-
26
-
27
-
28
-
29
-
30
-
31
-
32
-
33
-
34
-
35
-
36
-
37
-
38
-
39
-
40
-
41
-
42
-
43
-
44
-
45
-
46
-
47
-
48
-
49
-
50
-
51
-
52
-
53
-
54
-
55
-
56
-
57
-
58
-
59
-
60
-
61
-
62
-
63
-
64
-
65
-
66
-
67
-
68
-
69
-
70
-
71
-
72
-
73
-
74
-
75
-
76
-
77
-
78
-
79
-
80
-
81
-
82
-
83
-
84
-
85
-
86
-
87
-
88
-
89
-
90
-
91
-
92
-
93
-
94
-
95
-
96
-
97
-
98
-
99
-
100
-
101
-
102
-
103
-
104
-
105
-
106
-
107
-
108
-
109
-
110
-
111
-
112
-
113
-
114
-
115
-
116
-
117
-
118
-
119
-
120
-
121
-
122
-
123
-
124
-
125
-
126
-
127
-
128
-
129
-
130
-
131
-
132
-
133
-
134
-
135
-
136
-
137
-
138
-
139
-
140
-
141
-
142
-
143
-
144
-
145
-
146
-
147
-
148
-
149
-
150
-
151
-
152
-
153
-
154
-
155
-
156
-
157
-
158
-
159
-
160
-
161
-
162
-
163
-
164
-
165
-
166
-
167
-
168
-
169
-
170
-
171
-
172
-
173
-
174
-
175
-
176
-
177
-
178
-
179
-
180
-
181
-
182
-
183
-
184
-
185
-
186
-
187
-
188
-
189
-
190
-
191
-
192
-
193
-
194
-
195
-
196
-
197
-
198
-
199
-
200
-
201
-
202
-
203
-
204
-
205
-
206
-
207
-
208
-
209
-
210
-
211
-
212
-
213
-
214
-
215
-
216
-
217
-
218
-
219
-
220
-
221
-
222
-
223
-
224
-
225
-
226
-
227
-
228
-
229
-
230
-
231
-
232
-
233
-
234
-
235
-
236
-
237
-
238
-
239
-
240
-
241
-
242
-
243
-
244
-
245
-
246
-
247
-
248
-
249
-
250
-
251
-
252
-
253
-
254
-
255
-
256
-
257
-
258
-
259
-
260
-
261
-
262
-
263
-
264
-
265
-
266
-
267
-
268
-
269
-
270
-
271
-
272
-
273
-
274
-
275
-
276
-
277
-
278
-
279
-
280
-
281
-
282
-
283
-
284
-
285
-
286
-
287
-
288
-
289
-
290
-
291
-
292
-
293
-
294
-
295
-
296
-
297
-
298
-
299
-
300
-
301
-
302
-
303
-
304
-
305
-
306
-
307
-
308
-
309
-
310
-
311
-
312
-
313
-
314
-
315
-
316
-
317
-
318
-
319
-
320
-
321
-
322
-
323
-
324
-
325
-
326
-
327
-
328
-
329
-
330
-
331
-
332
-
333
-
334
-
335
-
336
-
337
-
338
-
339
-
340
-
341
-
342
-
343
-
344
-
345
-
346
-
347
-
348
-
349
-
350
-
351
-
352
-
353
-
354
-
355
-
356
-
357
-
358
-
359
-
360
-
361
-
362
-
363
-
364
-
365
-
366
-
367
-
368
-
369
-
370
-
371
-
372
-
373
-
374
-
375
-
376
-
377
-
378
-
379
-
380
-
381
-
382
-
383
-
384
-
385
-
386
-
387
-
388
-
389
-
390
-
391
-
392
-
393
-
394
-
395
-
396
-
397
-
398
-
399
-
400
-
401
-
402
-
403
-
404
-
405
-
406
-
407
-
408
-
409
-
410
-
411
-
412
-
413
-
414
-
415
-
416
-
417
-
 418
418 -
 419
419 -
 420
420 -
 421
421 -
 422
422 -
 423
423 -
 424
424 -
 425
425 -
 426
426 -
 427
427 -
 428
428 -
 429
429 -
 430
430 -
 431
431 -
 432
432 -
 433
433 -
 434
434 -
 435
435 -
 436
436 -
 437
437 -
 438
438 -
439
-
440
-
441
-
442
-
443
-
444
-
445
-
446
-
447
-
448
-
449
-
450
-
451
-
452
-
453
-
454
-
455
-
456
-
457
-
458
-
459
-
460
-
461
-
462
-
463
-
464
-
465
-
466
-
467
-
468
-
469
-
470
-
471
-
472
-
473
-
474
-
475
-
476
-
477
-
478
-
479
-
480
-
481
-
482
-
483
-
484
-
485
-
486
-
487
-
488
-
489
-
490
-
491
-
492
-
493
-
494
-
495
-
496
-
497
-
498
-
499
-
500
-
501
-
502
-
503
-
504
-
505
-
506
-
507
-
508
-
509
-
510
-
511
-
512
-
513
-
514
-
515
-
516
-
517
-
518
-
519
-
520
-
521
-
522
-
523
-
524
-
525
-
526
-
527
-
528
-
529
-
530
-
531
-
532
-
533
-
534
-
535
-
536
-
537
-
538
-
539
-
540
-
541
-
542
-
543
-
544
-
545
-
546
-
547
-
548
-
549
-
550
-
551
-
552
-
553
-
554
-
555
-
556
-
557
-
558
-
559
-
560
-
561
-
562
-
563
-
564
 |
 |

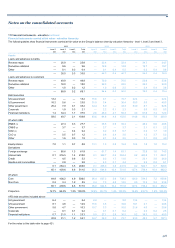
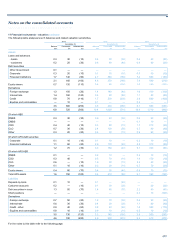
Notes on the consolidated accounts
426
11 Financial instruments - valuation continued
Collateralised debt obligations (CDO)
CDOs purchased from third-parties are valued using independent, third-
party quotes or independent lead manager indicative prices. For super
senior CDOs which have been originated by the Group no specific third-
party information is available. The valuation of these super senior CDOs
therefore takes into consideration outputs from a proprietary model,
market data and appropriate valuation adjustments.
A collateral net asset value methodology using dealer buy side price is
used to determine an upper bound for super senior CDO valuations. An
ABS index implied collateral valuation is also used to provide a market
calibrated valuation data point. Both the ABS index implied valuation and
the collateral net asset value methodology apply an assumed immediate
liquidation approach.
Collateralised loan obligations (CLO)
To determine the fair value of CLOs purchased from third parties, the
Group uses third party broker or lead manager quotes as the primary
pricing source. These quotes are benchmarked to consensus pricing
sources where they are available.
For CLOs originated and still held by the Group, the fair value is
determined using a correlation model based on a Monte Carlo simulation.
The main model inputs are credit spreads and recovery rates of the
underlying assets and their correlation. A credit curve is assigned to each
underlying asset based on prices from third party dealer quotes and cash
flow profiles, sourced from an industry standard model. Losses are
calculated taking into account the attachment and detachment point of
the exposure. Where the correlation inputs to this model are not
observable, CLOs are classified as level 3.
Other asset-backed and corporate debt securities
Where observable market prices for a particular debt security are not
available, the fair value will typically be determined with reference to
observable market transactions in other related products, such as similar
debt securities or credit derivatives. Assumptions are made about the
relationship between the individual debt security and available
benchmark data. Where significant management judgment has been
applied in identifying the most relevant related product, or in determining
the relationship between the related product and the instrument itself, the
instrument is classified as level 3.
Equity shares
Private equity investments include unit holdings and limited partnership
interests primarily in corporate private equity funds, debt funds and fund
of hedge funds. Externally managed funds are valued using recent prices
where available. Where not available, the fair value of investments in
externally managed funds is generally determined using statements or
other information provided by the fund managers.
The Group considers that valuations may rely significantly on the
judgments and estimates made by the fund managers, particularly in
assessing private equity components. Given the decline in liquidity in
world markets, and the level of subjectivity, these are included in level 3.
Derivatives
Derivatives are priced using quoted prices for the same or similar
instruments where these are available. However, the majority of
derivatives are valued using pricing models. Inputs for these models are
usually observed directly in the market, or derived from observed prices.
However, it is not always possible to observe or corroborate all model
inputs. Unobservable inputs used are based on estimates taking into
account a range of available information including historic analysis,
historic traded levels, market practice, comparison to other relevant
benchmark observable data and consensus pricing data.
Credit derivatives
The Group's other credit derivatives include vanilla and bespoke portfolio
tranches, gap risk products and certain other unique trades.
Valuation of single name credit derivatives is carried out using industry
standard models. Where single name derivatives have been traded and
there is a lack of independent data or the quality of the data is weak,
these instruments are classified into level 3. These assets will be priced
using the Group’s standard credit derivative model using a proxy curve
based upon a suitable alternative single name curve, a cash based
product or a sector based curve. Where the sector based curve is used,
the proxy will be chosen taking maturity, rating, seniority, geography and
internal credit review on recoveries into account. Sensitivities for these
instruments will be based upon the selection of reasonable alternative
assumptions which may include adjustments to the credit curve and
recovery rate assumptions.
The bespoke portfolio tranches are synthetic tranches referenced to a
bespoke portfolio of corporate names on which the Group purchases
credit protection. Bespoke portfolio tranches are valued using Gaussian
Copula, a standard method which uses observable market inputs (credit
spreads, index tranche prices and recovery rates) to generate an output
price for the tranche by way of a mapping methodology. In essence this
method takes the expected loss of the tranche expressed as a fraction of
the expected loss of the whole underlying portfolio and calculates which
detachment point on the liquid index, and hence which correlation level,
coincides with this expected loss fraction. Where the inputs to this
valuation technique are observable in the market, bespoke tranches are
considered to be level 2 assets. Where inputs are not observable,
bespoke tranches are considered to be level 3 assets. However, all
transactions executed with a CDPC counterparty are considered level 3
as the credit valuation adjustment applied to these exposures is a
significant component of these valuations.
Gap risk products are leveraged trades, with the counterparty's potential
loss capped at the amount of the initial principal invested. Gap risk is the
probability that the market will move discontinuously too quickly to exit a
portfolio and return the principal to the counterparty without incurring
losses, should an unwind event be triggered. This optionality is
embedded within these portfolio structures and is very rarely traded
outright in the market. Gap risk is not observable in the markets and, as
such, these structures are deemed to be level 3 instruments.