RBS 2013 Annual Report Download - page 240
Download and view the complete annual report
Please find page 240 of the 2013 RBS annual report below. You can navigate through the pages in the report by either clicking on the pages listed below, or by using the keyword search tool below to find specific information within the annual report.-
 1
1 -
2
-
3
-
4
-
5
-
6
-
7
-
8
-
9
-
10
-
11
-
12
-
13
-
14
-
15
-
16
-
17
-
18
-
19
-
20
-
21
-
22
-
23
-
24
-
25
-
26
-
27
-
28
-
29
-
30
-
31
-
32
-
33
-
34
-
35
-
36
-
37
-
38
-
39
-
40
-
41
-
42
-
43
-
44
-
45
-
46
-
47
-
48
-
49
-
50
-
51
-
52
-
53
-
54
-
55
-
56
-
57
-
58
-
59
-
60
-
61
-
62
-
63
-
64
-
65
-
66
-
67
-
68
-
69
-
70
-
71
-
72
-
73
-
74
-
75
-
76
-
77
-
78
-
79
-
80
-
81
-
82
-
83
-
84
-
85
-
86
-
87
-
88
-
89
-
90
-
91
-
92
-
93
-
94
-
95
-
96
-
97
-
98
-
99
-
100
-
101
-
102
-
103
-
104
-
105
-
106
-
107
-
108
-
109
-
110
-
111
-
112
-
113
-
114
-
115
-
116
-
117
-
118
-
119
-
120
-
121
-
122
-
123
-
124
-
125
-
126
-
127
-
128
-
129
-
130
-
131
-
132
-
133
-
134
-
135
-
136
-
137
-
138
-
139
-
140
-
141
-
142
-
143
-
144
-
145
-
146
-
147
-
148
-
149
-
150
-
151
-
152
-
153
-
154
-
155
-
156
-
157
-
158
-
159
-
160
-
161
-
162
-
163
-
164
-
165
-
166
-
167
-
168
-
169
-
170
-
171
-
172
-
173
-
174
-
175
-
176
-
177
-
178
-
179
-
180
-
181
-
182
-
183
-
184
-
185
-
186
-
187
-
188
-
189
-
190
-
191
-
192
-
193
-
194
-
195
-
196
-
197
-
198
-
199
-
200
-
201
-
202
-
203
-
204
-
205
-
206
-
207
-
208
-
209
-
210
-
211
-
212
-
213
-
214
-
215
-
216
-
217
-
218
-
219
-
220
-
221
-
222
-
223
-
224
-
225
-
226
-
227
-
228
-
229
-
 230
230 -
 231
231 -
 232
232 -
 233
233 -
 234
234 -
 235
235 -
 236
236 -
 237
237 -
 238
238 -
 239
239 -
 240
240 -
 241
241 -
 242
242 -
 243
243 -
 244
244 -
 245
245 -
 246
246 -
 247
247 -
 248
248 -
 249
249 -
 250
250 -
251
-
252
-
253
-
254
-
255
-
256
-
257
-
258
-
259
-
260
-
261
-
262
-
263
-
264
-
265
-
266
-
267
-
268
-
269
-
270
-
271
-
272
-
273
-
274
-
275
-
276
-
277
-
278
-
279
-
280
-
281
-
282
-
283
-
284
-
285
-
286
-
287
-
288
-
289
-
290
-
291
-
292
-
293
-
294
-
295
-
296
-
297
-
298
-
299
-
300
-
301
-
302
-
303
-
304
-
305
-
306
-
307
-
308
-
309
-
310
-
311
-
312
-
313
-
314
-
315
-
316
-
317
-
318
-
319
-
320
-
321
-
322
-
323
-
324
-
325
-
326
-
327
-
328
-
329
-
330
-
331
-
332
-
333
-
334
-
335
-
336
-
337
-
338
-
339
-
340
-
341
-
342
-
343
-
344
-
345
-
346
-
347
-
348
-
349
-
350
-
351
-
352
-
353
-
354
-
355
-
356
-
357
-
358
-
359
-
360
-
361
-
362
-
363
-
364
-
365
-
366
-
367
-
368
-
369
-
370
-
371
-
372
-
373
-
374
-
375
-
376
-
377
-
378
-
379
-
380
-
381
-
382
-
383
-
384
-
385
-
386
-
387
-
388
-
389
-
390
-
391
-
392
-
393
-
394
-
395
-
396
-
397
-
398
-
399
-
400
-
401
-
402
-
403
-
404
-
405
-
406
-
407
-
408
-
409
-
410
-
411
-
412
-
413
-
414
-
415
-
416
-
417
-
418
-
419
-
420
-
421
-
422
-
423
-
424
-
425
-
426
-
427
-
428
-
429
-
430
-
431
-
432
-
433
-
434
-
435
-
436
-
437
-
438
-
439
-
440
-
441
-
442
-
443
-
444
-
445
-
446
-
447
-
448
-
449
-
450
-
451
-
452
-
453
-
454
-
455
-
456
-
457
-
458
-
459
-
460
-
461
-
462
-
463
-
464
-
465
-
466
-
467
-
468
-
469
-
470
-
471
-
472
-
473
-
474
-
475
-
476
-
477
-
478
-
479
-
480
-
481
-
482
-
483
-
484
-
485
-
486
-
487
-
488
-
489
-
490
-
491
-
492
-
493
-
494
-
495
-
496
-
497
-
498
-
499
-
500
-
501
-
502
-
503
-
504
-
505
-
506
-
507
-
508
-
509
-
510
-
511
-
512
-
513
-
514
-
515
-
516
-
517
-
518
-
519
-
520
-
521
-
522
-
523
-
524
-
525
-
526
-
527
-
528
-
529
-
530
-
531
-
532
-
533
-
534
-
535
-
536
-
537
-
538
-
539
-
540
-
541
-
542
-
543
-
544
-
545
-
546
-
547
-
548
-
549
-
550
-
551
-
552
-
553
-
554
-
555
-
556
-
557
-
558
-
559
-
560
-
561
-
562
-
563
-
564
 |
 |

Business review Risk and balance sheet management
238
Credit risk continued
Risk mitigation continued
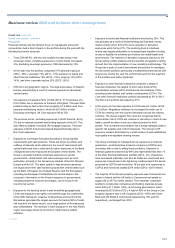
Lending
The types of collateral the Group takes to mitigate the credit risk arising
from wholesale lending varies according to the nature of the counterparty
and its assets. The most common types are:
• Commercial real estate - The market value of the collateral typically
exceeds the loan amount at origination date. The market value is
defined as the estimated amount for which the asset could be sold in
an arm’s length transaction by a willing seller to a willing buyer. In
Ireland and, to a lesser extent, the UK, a lack of market data has
made estimating the value of property difficult and so causes the
Group to use a range of other types of information to value such
collateral, including expert judgement and indices. For further
information, regarding the Group’s commercial real estate portfolio
refer to pages 252 to 257.
• Residential property - The Group takes collateral in the form of
residential property to mitigate the credit risk arising from mortgages
and home equity lending. The Group values residential property
during the loan underwriting process by either appraising properties
individually or using statistically valid models. The Group updates
residential property values quarterly using the relevant residential
property index, namely the Halifax Quarterly Regional House Price
Index in the UK, the Case-Shiller Home Price Index in the US, the
Central Statistics Office Residential Property Price Index in the ROI,
and the Nationwide House Price Index in Northern Ireland.
• Physical assets - These may include stock, plant, equipment,
machinery, vehicles, ships and aircraft. Such assets are suitable
collateral only if the Group can identify, locate, and segregate them
from other assets on which it does not have a claim. The Group
values physical assets in a variety of different ways, depending on
the type of asset concerned and may rely on balance sheet
valuations in certain cases. In the US, the Group also takes
collateral in the form of motor vehicles to mitigate the credit risk
arising from automobile lending. The Group values new vehicles at
cost and used ones at the relevant average trade-in value.
• Receivables - These are amounts owed to the Group’s
counterparties by their own customers. The Group values them after
taking into account the quality of its counterparty’s receivable
management processes and excluding any that are past due.
All collateral is assessed case-by-case to ensure that it will retain its
value independently of the provider. The Group monitors the value of the
collateral and, if there is a shortfall, will seek additional collateral.
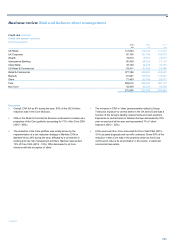
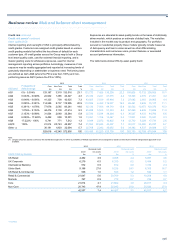
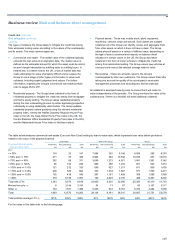
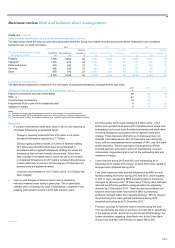
The table below analyses commercial real estate (Core and Non-Core) lending by loan-to-value ratio, which represents loan value before provisions
relative to the value of the property financed.
Ulster Bank Rest of the Group Group
Performing Non-performing Total Performing Non-performing Total Performing Non-performing Total
Commercial real estate
loan-to-value ratio £m £m £m £m £m £m £m £m £m
2013
<= 50% 124 23 147 7,884 262 8,146 8,008 285 8,293
> 50% and <= 70% 271 55 326 9,962 582 10,544 10,233 637 10,870
> 70% and <= 90% 282 89 371 3,699 1,272 4,971 3,981 1,361 5,342
> 90% and <= 100% 86 154 240 865 368 1,233 951 522 1,473
> 100% and <= 110% 121 212 333 690 627 1,317 811 839 1,650
> 110% and <= 130% 238 366 604 333 1,334 1,667 571 1,700 2,271
> 130% and <= 150% 102 438 540 267 1,161 1,428 369 1,599 1,968
> 150% 319 6,738 7,057 150 2,629 2,779 469 9,367 9,836
Total with LTVs 1,543 8,075 9,618 23,850 8,235 32,085 25,393 16,310 41,703
Minimal security (1) 6 3,144 3,150 54 13 67 60 3,157 3,217
Other (2) 144 1,351 1,495 5,230 933 6,163 5,374 2,284 7,658
Total 1,693 12,570 14,263 29,134 9,181 38,315 30,827 21,751 52,578
Total portfolio average LTV (3) 121% 376% 335% 61% 149% 84% 65% 261% 142%
For the notes to this table refer to the following page.