RBS 2013 Annual Report Download - page 136
Download and view the complete annual report
Please find page 136 of the 2013 RBS annual report below. You can navigate through the pages in the report by either clicking on the pages listed below, or by using the keyword search tool below to find specific information within the annual report.-
 1
1 -
2
-
3
-
4
-
5
-
6
-
7
-
8
-
9
-
10
-
11
-
12
-
13
-
14
-
15
-
16
-
17
-
18
-
19
-
20
-
21
-
22
-
23
-
24
-
25
-
26
-
27
-
28
-
29
-
30
-
31
-
32
-
33
-
34
-
35
-
36
-
37
-
38
-
39
-
40
-
41
-
42
-
43
-
44
-
45
-
46
-
47
-
48
-
49
-
50
-
51
-
52
-
53
-
54
-
55
-
56
-
57
-
58
-
59
-
60
-
61
-
62
-
63
-
64
-
65
-
66
-
67
-
68
-
69
-
70
-
71
-
72
-
73
-
74
-
75
-
76
-
77
-
78
-
79
-
80
-
81
-
82
-
83
-
84
-
85
-
86
-
87
-
88
-
89
-
90
-
91
-
92
-
93
-
94
-
95
-
96
-
97
-
98
-
99
-
100
-
101
-
102
-
103
-
104
-
105
-
106
-
107
-
108
-
109
-
110
-
111
-
112
-
113
-
114
-
115
-
116
-
117
-
118
-
119
-
120
-
121
-
122
-
123
-
124
-
125
-
 126
126 -
 127
127 -
 128
128 -
 129
129 -
 130
130 -
 131
131 -
 132
132 -
 133
133 -
 134
134 -
 135
135 -
 136
136 -
 137
137 -
 138
138 -
 139
139 -
 140
140 -
 141
141 -
 142
142 -
 143
143 -
 144
144 -
 145
145 -
 146
146 -
147
-
148
-
149
-
150
-
151
-
152
-
153
-
154
-
155
-
156
-
157
-
158
-
159
-
160
-
161
-
162
-
163
-
164
-
165
-
166
-
167
-
168
-
169
-
170
-
171
-
172
-
173
-
174
-
175
-
176
-
177
-
178
-
179
-
180
-
181
-
182
-
183
-
184
-
185
-
186
-
187
-
188
-
189
-
190
-
191
-
192
-
193
-
194
-
195
-
196
-
197
-
198
-
199
-
200
-
201
-
202
-
203
-
204
-
205
-
206
-
207
-
208
-
209
-
210
-
211
-
212
-
213
-
214
-
215
-
216
-
217
-
218
-
219
-
220
-
221
-
222
-
223
-
224
-
225
-
226
-
227
-
228
-
229
-
230
-
231
-
232
-
233
-
234
-
235
-
236
-
237
-
238
-
239
-
240
-
241
-
242
-
243
-
244
-
245
-
246
-
247
-
248
-
249
-
250
-
251
-
252
-
253
-
254
-
255
-
256
-
257
-
258
-
259
-
260
-
261
-
262
-
263
-
264
-
265
-
266
-
267
-
268
-
269
-
270
-
271
-
272
-
273
-
274
-
275
-
276
-
277
-
278
-
279
-
280
-
281
-
282
-
283
-
284
-
285
-
286
-
287
-
288
-
289
-
290
-
291
-
292
-
293
-
294
-
295
-
296
-
297
-
298
-
299
-
300
-
301
-
302
-
303
-
304
-
305
-
306
-
307
-
308
-
309
-
310
-
311
-
312
-
313
-
314
-
315
-
316
-
317
-
318
-
319
-
320
-
321
-
322
-
323
-
324
-
325
-
326
-
327
-
328
-
329
-
330
-
331
-
332
-
333
-
334
-
335
-
336
-
337
-
338
-
339
-
340
-
341
-
342
-
343
-
344
-
345
-
346
-
347
-
348
-
349
-
350
-
351
-
352
-
353
-
354
-
355
-
356
-
357
-
358
-
359
-
360
-
361
-
362
-
363
-
364
-
365
-
366
-
367
-
368
-
369
-
370
-
371
-
372
-
373
-
374
-
375
-
376
-
377
-
378
-
379
-
380
-
381
-
382
-
383
-
384
-
385
-
386
-
387
-
388
-
389
-
390
-
391
-
392
-
393
-
394
-
395
-
396
-
397
-
398
-
399
-
400
-
401
-
402
-
403
-
404
-
405
-
406
-
407
-
408
-
409
-
410
-
411
-
412
-
413
-
414
-
415
-
416
-
417
-
418
-
419
-
420
-
421
-
422
-
423
-
424
-
425
-
426
-
427
-
428
-
429
-
430
-
431
-
432
-
433
-
434
-
435
-
436
-
437
-
438
-
439
-
440
-
441
-
442
-
443
-
444
-
445
-
446
-
447
-
448
-
449
-
450
-
451
-
452
-
453
-
454
-
455
-
456
-
457
-
458
-
459
-
460
-
461
-
462
-
463
-
464
-
465
-
466
-
467
-
468
-
469
-
470
-
471
-
472
-
473
-
474
-
475
-
476
-
477
-
478
-
479
-
480
-
481
-
482
-
483
-
484
-
485
-
486
-
487
-
488
-
489
-
490
-
491
-
492
-
493
-
494
-
495
-
496
-
497
-
498
-
499
-
500
-
501
-
502
-
503
-
504
-
505
-
506
-
507
-
508
-
509
-
510
-
511
-
512
-
513
-
514
-
515
-
516
-
517
-
518
-
519
-
520
-
521
-
522
-
523
-
524
-
525
-
526
-
527
-
528
-
529
-
530
-
531
-
532
-
533
-
534
-
535
-
536
-
537
-
538
-
539
-
540
-
541
-
542
-
543
-
544
-
545
-
546
-
547
-
548
-
549
-
550
-
551
-
552
-
553
-
554
-
555
-
556
-
557
-
558
-
559
-
560
-
561
-
562
-
563
-
564
 |
 |

Business review
134
UK Retail continued
• Significant focus on streamlining processes has benefited all
distribution channels, with the capacity created allowing more time
for staff coaching and resulting in advisors spending more time and
having better conversations with customers.
• In addition, our product range has been simplified down from 56 to
46 with several products winning awards. A highlight of this UK
Retail strategy is the success of the new instant saver product
launched in Q4 2012, which at the end of 2013 had more than £10
billion in balances. Furthermore, nearly 800,000 customers have
registered for Cashback Plus online since launch in Q3 2013 and
are being rewarded for using their debit cards with selected retailers.
• A major branch refurbishment programme is under way with over
one quarter completed. 350 branches now have a digital banking
zone where customers can use in-branch technology to access
online banking. Wi-Fi in-branch allows customers to access their
account via their own devices.
During 2013 good progress has been made with FCA (Financial Conduct
Authority) reportable complaints, which declined 22%. In addition, the
provision relating to historic Payment Protection Insurance (PPI) mis-
selling was increased by £860 million, bringing the total to £3.0 billion.
The PPI expense is not included in the operating profit of UK Retail.
In 2014, UK Retail will aim to maintain a leading position in digital
banking, launching new capability and customer proposition through
mobile devices.
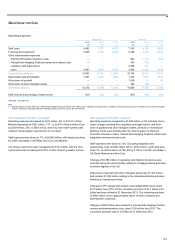
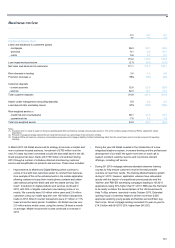
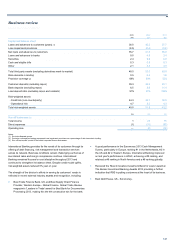
2013 compared with 2012
Operating profit increased by 3% to £1,943 million driven by a 39%
decline in impairment losses. Net interest income was broadly stable,
though investment advice income was adversely impacted following
changes introduced by the Retail Distribution Review (RDR). Costs
increased primarily because of a higher FSCS levy and other regulatory
charges totalling £116 million in the year, conduct-related provisions of
£63 million and additional technology investment of £45 million.
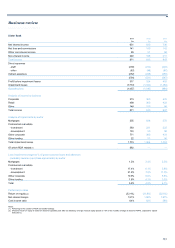
Mortgage balance growth was affected in H1 2013 by mortgage advisor
training; however, balances recovered during H2 2013 assisted by early
adoption of the second phase of the UK Government’s Help To Buy
scheme. Gross lending increased to £8.9 billion in H2 2013. Customer
deposits increased by 7%, above the UK market average of 4% due to
strong growth in both current accounts (13%) and instant access savings
accounts (15%).
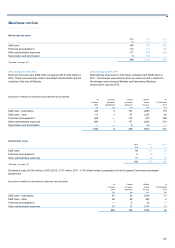
Net interest income was broadly flat.
• Mortgage new business margins reduced in line with market
conditions; however, overall book margins improved.
• Deposit margins declined reflecting the impact of continued lower
rates on current account hedges. Savings margins, however, have
increased over 2013 with improved market pricing.
Non-interest income fell by 2% to £958 million due to subdued advice
income post RDR.
Direct costs increased by 7% due to higher FSCS levy and other
regulatory charges and conduct-related provisions of £63 million. This
was partly offset by lower staff costs due to a reduction in headcount of
2,300. Indirect costs increased by 3%, largely due to investment in
technology.
Impairments declined by 39% to £324 million due to lower customer
defaults across all products reflecting continued improvement in asset
quality.
Risk-weighted assets declined by 4% to £43.9 billion largely reflecting
balance reductions across the unsecured portfolio and quality
improvements.
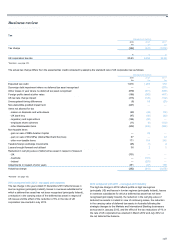
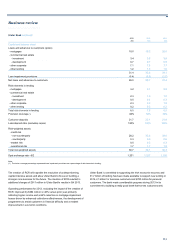
2012 compared with 2011
Operating profit fell by 6% as a 10% decline in income was only partly
offset by lower costs, down 6%, and improved impairment losses, down
33%.
Mortgage balances grew by £4.1 billion with the share of new business at
10%, ahead of our stock level of 8%. Growth as a result of FLS was
starting to appear by the end of the year as mortgage applications moved
through the pipeline to completion. Deposit growth of 6% was in line with
the market and drove a 300 basis point improvement in the loan:deposit
ratio to 103%.
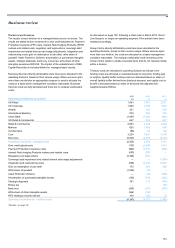
Net interest income was down 7% due to weaker deposit margins and
reduction in unsecured balances, partly offset by mortgage growth.
Unsecured balances now represent 13% of total loans and advances to
customers compared with 23% in 2008, following realignment of risk
appetite and strong mortgage growth. Net interest margin declined as a
result of lower rates on current account hedges and increased
competition on savings rates in the early part of the year, partly offset by
widening asset margins.
Non-interest income was 19% lower mainly due to:
• lower unauthorised overdraft fees as we continue to help customers
manage their finances by providing mobile text alerts and further
improving mobile banking functionality;
• weak consumer confidence lowering spending and associated fees
on cards; and
• lower investment income as a result of weak customer demand and
less advisor availability due to restructuring and retraining in
preparation for regulatory changes in 2013.
Costs were down £150 million, 6%, driven by the ongoing simplification of
processes across the business, lower headcount and lower FSCS levy.
Impairment losses were £259 million or 33% lower, reflecting the
continued benefit of risk appetite tightening in prior years and also a
smaller unsecured loan book. Impairments as a percentage of loans and
advances were 50 basis points versus 70 basis points in 2011.
Risk-weighted assets continued to improve over the year as the portfolio
mix adjusted, with increases in lower-risk secured mortgages, decreases
in unsecured lending and further quality improvements across the book.