RBS 2013 Annual Report Download - page 151
Download and view the complete annual report
Please find page 151 of the 2013 RBS annual report below. You can navigate through the pages in the report by either clicking on the pages listed below, or by using the keyword search tool below to find specific information within the annual report.-
 1
1 -
2
-
3
-
4
-
5
-
6
-
7
-
8
-
9
-
10
-
11
-
12
-
13
-
14
-
15
-
16
-
17
-
18
-
19
-
20
-
21
-
22
-
23
-
24
-
25
-
26
-
27
-
28
-
29
-
30
-
31
-
32
-
33
-
34
-
35
-
36
-
37
-
38
-
39
-
40
-
41
-
42
-
43
-
44
-
45
-
46
-
47
-
48
-
49
-
50
-
51
-
52
-
53
-
54
-
55
-
56
-
57
-
58
-
59
-
60
-
61
-
62
-
63
-
64
-
65
-
66
-
67
-
68
-
69
-
70
-
71
-
72
-
73
-
74
-
75
-
76
-
77
-
78
-
79
-
80
-
81
-
82
-
83
-
84
-
85
-
86
-
87
-
88
-
89
-
90
-
91
-
92
-
93
-
94
-
95
-
96
-
97
-
98
-
99
-
100
-
101
-
102
-
103
-
104
-
105
-
106
-
107
-
108
-
109
-
110
-
111
-
112
-
113
-
114
-
115
-
116
-
117
-
118
-
119
-
120
-
121
-
122
-
123
-
124
-
125
-
126
-
127
-
128
-
129
-
130
-
131
-
132
-
133
-
134
-
135
-
136
-
137
-
138
-
139
-
140
-
 141
141 -
 142
142 -
 143
143 -
 144
144 -
 145
145 -
 146
146 -
 147
147 -
 148
148 -
 149
149 -
 150
150 -
 151
151 -
 152
152 -
 153
153 -
 154
154 -
 155
155 -
 156
156 -
 157
157 -
 158
158 -
 159
159 -
 160
160 -
 161
161 -
162
-
163
-
164
-
165
-
166
-
167
-
168
-
169
-
170
-
171
-
172
-
173
-
174
-
175
-
176
-
177
-
178
-
179
-
180
-
181
-
182
-
183
-
184
-
185
-
186
-
187
-
188
-
189
-
190
-
191
-
192
-
193
-
194
-
195
-
196
-
197
-
198
-
199
-
200
-
201
-
202
-
203
-
204
-
205
-
206
-
207
-
208
-
209
-
210
-
211
-
212
-
213
-
214
-
215
-
216
-
217
-
218
-
219
-
220
-
221
-
222
-
223
-
224
-
225
-
226
-
227
-
228
-
229
-
230
-
231
-
232
-
233
-
234
-
235
-
236
-
237
-
238
-
239
-
240
-
241
-
242
-
243
-
244
-
245
-
246
-
247
-
248
-
249
-
250
-
251
-
252
-
253
-
254
-
255
-
256
-
257
-
258
-
259
-
260
-
261
-
262
-
263
-
264
-
265
-
266
-
267
-
268
-
269
-
270
-
271
-
272
-
273
-
274
-
275
-
276
-
277
-
278
-
279
-
280
-
281
-
282
-
283
-
284
-
285
-
286
-
287
-
288
-
289
-
290
-
291
-
292
-
293
-
294
-
295
-
296
-
297
-
298
-
299
-
300
-
301
-
302
-
303
-
304
-
305
-
306
-
307
-
308
-
309
-
310
-
311
-
312
-
313
-
314
-
315
-
316
-
317
-
318
-
319
-
320
-
321
-
322
-
323
-
324
-
325
-
326
-
327
-
328
-
329
-
330
-
331
-
332
-
333
-
334
-
335
-
336
-
337
-
338
-
339
-
340
-
341
-
342
-
343
-
344
-
345
-
346
-
347
-
348
-
349
-
350
-
351
-
352
-
353
-
354
-
355
-
356
-
357
-
358
-
359
-
360
-
361
-
362
-
363
-
364
-
365
-
366
-
367
-
368
-
369
-
370
-
371
-
372
-
373
-
374
-
375
-
376
-
377
-
378
-
379
-
380
-
381
-
382
-
383
-
384
-
385
-
386
-
387
-
388
-
389
-
390
-
391
-
392
-
393
-
394
-
395
-
396
-
397
-
398
-
399
-
400
-
401
-
402
-
403
-
404
-
405
-
406
-
407
-
408
-
409
-
410
-
411
-
412
-
413
-
414
-
415
-
416
-
417
-
418
-
419
-
420
-
421
-
422
-
423
-
424
-
425
-
426
-
427
-
428
-
429
-
430
-
431
-
432
-
433
-
434
-
435
-
436
-
437
-
438
-
439
-
440
-
441
-
442
-
443
-
444
-
445
-
446
-
447
-
448
-
449
-
450
-
451
-
452
-
453
-
454
-
455
-
456
-
457
-
458
-
459
-
460
-
461
-
462
-
463
-
464
-
465
-
466
-
467
-
468
-
469
-
470
-
471
-
472
-
473
-
474
-
475
-
476
-
477
-
478
-
479
-
480
-
481
-
482
-
483
-
484
-
485
-
486
-
487
-
488
-
489
-
490
-
491
-
492
-
493
-
494
-
495
-
496
-
497
-
498
-
499
-
500
-
501
-
502
-
503
-
504
-
505
-
506
-
507
-
508
-
509
-
510
-
511
-
512
-
513
-
514
-
515
-
516
-
517
-
518
-
519
-
520
-
521
-
522
-
523
-
524
-
525
-
526
-
527
-
528
-
529
-
530
-
531
-
532
-
533
-
534
-
535
-
536
-
537
-
538
-
539
-
540
-
541
-
542
-
543
-
544
-
545
-
546
-
547
-
548
-
549
-
550
-
551
-
552
-
553
-
554
-
555
-
556
-
557
-
558
-
559
-
560
-
561
-
562
-
563
-
564
 |
 |

Business review
149
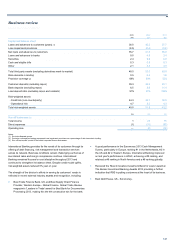
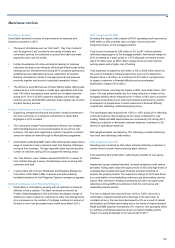
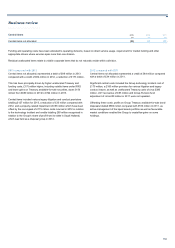
2013 compared with 2012
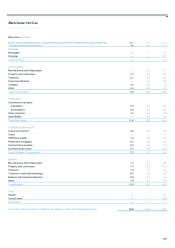
Operating profit of £647 million ($1,012 million) was down £107 million
($184 million), or 14%. The operating environment and market conditions
remained challenging, with intense competition for loans. An extended
period of low short-term rates limited net interest margin expansion and
the rise in long-term rates dramatically slowed mortgage refinance
volumes.
Net interest income was down 1% at £1,916 million ($2,998 million) due
to a smaller investment portfolio, consumer loan run-off and the effect of
prevailing economic conditions on asset yields partially offset by the
benefit of interest rate swaps, commercial loan growth and favourable
funding costs.
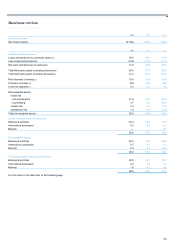
Average loans and advances were flat, with commercial loan growth of
5% despite competition for lending opportunities offset by run-off of long-
term fixed-rate consumer products.
Average customer deposits were flat, with planned run-off of high priced
time deposits and lower wholesale deposits offset by growth achieved in
checking and money market balances. Consumer checking balances
grew by 3% while small business checking balances grew by 7% over the
year.
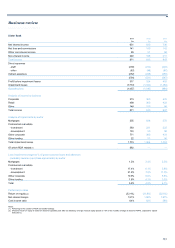
Excluding the £47 million ($75 million) gross gain on the sale of Visa B
shares in 2012, non-interest income was down £39 million ($83 million),
or 4% at £1,073 million ($1,679 million), reflecting lower mortgage
banking fees as refinancing volumes have slowed, and lower deposit
fees. This was partially offset by higher securities gains and commercial
banking fee income.
Excluding the £88 million ($138 million) litigation settlement in 2012
relating to a class action lawsuit regarding the way overdraft fees were
assessed on customer accounts prior to 2010 and the £8 million ($13
million) litigation reserve associated with the sale of Visa B shares, total
expenses of £2,186 million ($3,421 million) were broadly in line with prior
year. This largely reflects a mortgage servicing rights impairment
recapture driven by the increase in long-term rates offset by the cost of
regulatory compliance and new technology investments and a one-off
£21 million ($33 million) pension gain in 2012.
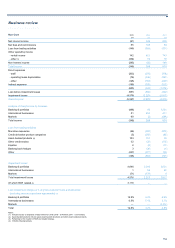
Impairment losses increased by £65 million ($99 million) to £156 million
($244 million) for the year and represented 0.3% of loans and advances
to customers.
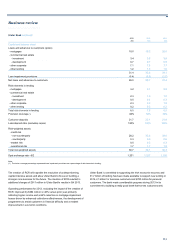
2012 compared with 2011
US Retail & Commercial posted an operating profit of £754 million
($1,196 million), up £217 million ($336 million), or 40%, from 2011.
Excluding the £88 million ($138 million) litigation settlement in Q1 2012
and the £39 million ($62 million) net gain on the sale of Visa B shares in
Q2 2012, operating profit was up £266 million ($412 million), or 50%,
largely reflecting lower impairment losses due to an improved credit
environment.
Net interest income was up £53 million ($47 million), or 3%, driven by
targeted commercial loan growth, deposit pricing discipline and lower
funding costs. This was partially offset by consumer loan run-off and
lower asset yields reflecting prevailing economic conditions.
Non-interest income was up £7 million. In US dollar terms non-interest
income was down $10 million, or 1%, reflecting a decline in debit card
fees as a result of the Durbin Amendment legislation and lower securities
gains and deposit fees. This was largely offset by strong mortgage
banking fees of £69 million ($109 million), up 71%, and the £47 million
($75 million) gross gain on the sale of Visa B shares.
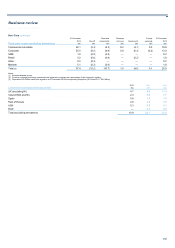
Gross loans and advances to customers were down £0.3 billion. In US
dollar terms loans and advances to customers were up $3.1 billion, or
4%, due to strong growth in commercial loan volumes.
Customer deposits decreased by 1% as a result of movements in foreign
exchange rates partially offset by strong growth achieved in checking
balances. Consumer checking balances fell by 1% while small business
checking balances grew by 4% over the year.
Excluding the £88 million ($138 million) litigation settlement, relating to a
class action lawsuit regarding the way overdraft fees were assessed on
customer accounts prior to 2010, and the £8 million ($13 million) litigation
reserve associated with the sale of Visa B shares, and a one-off £21
million ($33 million) pension gain in Q4 2012, total expenses were down
1%, reflecting lower loan collection costs and the elimination of the
Everyday Points rewards programme for consumer debit card customers,
partially offset by higher operational losses.
During the year, RBS Citizens offered former employees a one-time
opportunity to receive the value of future pension benefits as a single
lump sum payment. The transaction allowed RBS Citizens to partially de-
risk its pension plan and future liability under the plan. A strong
participant take-up rate of 60% enabled RBS Citizens to reduce its
pension liability by 17% and recognise a £21 million ($33 million)
accounting gain.
Impairment losses were down £235 million ($379 million), or 72%,
reflecting an improved credit environment and lower impairments on
securities. Loan impairments improved by £168 million ($266 million)
driven primarily by commercial loan impairments. Impairments as a
percentage of loans and advances fell to 20 basis points.