RBS 2013 Annual Report Download - page 411
Download and view the complete annual report
Please find page 411 of the 2013 RBS annual report below. You can navigate through the pages in the report by either clicking on the pages listed below, or by using the keyword search tool below to find specific information within the annual report.-
 1
1 -
2
-
3
-
4
-
5
-
6
-
7
-
8
-
9
-
10
-
11
-
12
-
13
-
14
-
15
-
16
-
17
-
18
-
19
-
20
-
21
-
22
-
23
-
24
-
25
-
26
-
27
-
28
-
29
-
30
-
31
-
32
-
33
-
34
-
35
-
36
-
37
-
38
-
39
-
40
-
41
-
42
-
43
-
44
-
45
-
46
-
47
-
48
-
49
-
50
-
51
-
52
-
53
-
54
-
55
-
56
-
57
-
58
-
59
-
60
-
61
-
62
-
63
-
64
-
65
-
66
-
67
-
68
-
69
-
70
-
71
-
72
-
73
-
74
-
75
-
76
-
77
-
78
-
79
-
80
-
81
-
82
-
83
-
84
-
85
-
86
-
87
-
88
-
89
-
90
-
91
-
92
-
93
-
94
-
95
-
96
-
97
-
98
-
99
-
100
-
101
-
102
-
103
-
104
-
105
-
106
-
107
-
108
-
109
-
110
-
111
-
112
-
113
-
114
-
115
-
116
-
117
-
118
-
119
-
120
-
121
-
122
-
123
-
124
-
125
-
126
-
127
-
128
-
129
-
130
-
131
-
132
-
133
-
134
-
135
-
136
-
137
-
138
-
139
-
140
-
141
-
142
-
143
-
144
-
145
-
146
-
147
-
148
-
149
-
150
-
151
-
152
-
153
-
154
-
155
-
156
-
157
-
158
-
159
-
160
-
161
-
162
-
163
-
164
-
165
-
166
-
167
-
168
-
169
-
170
-
171
-
172
-
173
-
174
-
175
-
176
-
177
-
178
-
179
-
180
-
181
-
182
-
183
-
184
-
185
-
186
-
187
-
188
-
189
-
190
-
191
-
192
-
193
-
194
-
195
-
196
-
197
-
198
-
199
-
200
-
201
-
202
-
203
-
204
-
205
-
206
-
207
-
208
-
209
-
210
-
211
-
212
-
213
-
214
-
215
-
216
-
217
-
218
-
219
-
220
-
221
-
222
-
223
-
224
-
225
-
226
-
227
-
228
-
229
-
230
-
231
-
232
-
233
-
234
-
235
-
236
-
237
-
238
-
239
-
240
-
241
-
242
-
243
-
244
-
245
-
246
-
247
-
248
-
249
-
250
-
251
-
252
-
253
-
254
-
255
-
256
-
257
-
258
-
259
-
260
-
261
-
262
-
263
-
264
-
265
-
266
-
267
-
268
-
269
-
270
-
271
-
272
-
273
-
274
-
275
-
276
-
277
-
278
-
279
-
280
-
281
-
282
-
283
-
284
-
285
-
286
-
287
-
288
-
289
-
290
-
291
-
292
-
293
-
294
-
295
-
296
-
297
-
298
-
299
-
300
-
301
-
302
-
303
-
304
-
305
-
306
-
307
-
308
-
309
-
310
-
311
-
312
-
313
-
314
-
315
-
316
-
317
-
318
-
319
-
320
-
321
-
322
-
323
-
324
-
325
-
326
-
327
-
328
-
329
-
330
-
331
-
332
-
333
-
334
-
335
-
336
-
337
-
338
-
339
-
340
-
341
-
342
-
343
-
344
-
345
-
346
-
347
-
348
-
349
-
350
-
351
-
352
-
353
-
354
-
355
-
356
-
357
-
358
-
359
-
360
-
361
-
362
-
363
-
364
-
365
-
366
-
367
-
368
-
369
-
370
-
371
-
372
-
373
-
374
-
375
-
376
-
377
-
378
-
379
-
380
-
381
-
382
-
383
-
384
-
385
-
386
-
387
-
388
-
389
-
390
-
391
-
392
-
393
-
394
-
395
-
396
-
397
-
398
-
399
-
400
-
 401
401 -
 402
402 -
 403
403 -
 404
404 -
 405
405 -
 406
406 -
 407
407 -
 408
408 -
 409
409 -
 410
410 -
 411
411 -
 412
412 -
 413
413 -
 414
414 -
 415
415 -
 416
416 -
 417
417 -
 418
418 -
 419
419 -
 420
420 -
 421
421 -
422
-
423
-
424
-
425
-
426
-
427
-
428
-
429
-
430
-
431
-
432
-
433
-
434
-
435
-
436
-
437
-
438
-
439
-
440
-
441
-
442
-
443
-
444
-
445
-
446
-
447
-
448
-
449
-
450
-
451
-
452
-
453
-
454
-
455
-
456
-
457
-
458
-
459
-
460
-
461
-
462
-
463
-
464
-
465
-
466
-
467
-
468
-
469
-
470
-
471
-
472
-
473
-
474
-
475
-
476
-
477
-
478
-
479
-
480
-
481
-
482
-
483
-
484
-
485
-
486
-
487
-
488
-
489
-
490
-
491
-
492
-
493
-
494
-
495
-
496
-
497
-
498
-
499
-
500
-
501
-
502
-
503
-
504
-
505
-
506
-
507
-
508
-
509
-
510
-
511
-
512
-
513
-
514
-
515
-
516
-
517
-
518
-
519
-
520
-
521
-
522
-
523
-
524
-
525
-
526
-
527
-
528
-
529
-
530
-
531
-
532
-
533
-
534
-
535
-
536
-
537
-
538
-
539
-
540
-
541
-
542
-
543
-
544
-
545
-
546
-
547
-
548
-
549
-
550
-
551
-
552
-
553
-
554
-
555
-
556
-
557
-
558
-
559
-
560
-
561
-
562
-
563
-
564
 |
 |

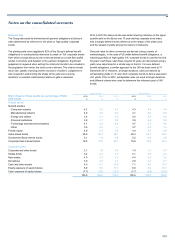
Notes on the consolidated accounts
409
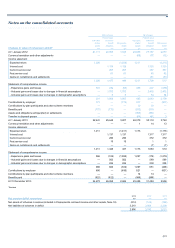
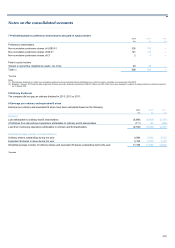
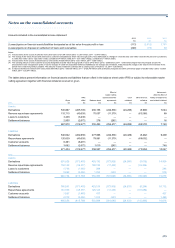
Amounts included in the consolidated income statement:
2013 2012 2011
£m £m £m
(Losses)/gains on financial assets/liabilities designated as at fair value through profit or loss (113) (2,612) 1,761
(Losses)/gains on disposal or settlement of loans and receivables (248) (76) 59
Notes:
(1) Includes items in the course of collection from other banks of £1,454 million (2012 - £1,531 million; 2011 - £1,470 million).
(2) The change in fair value of loans and advances to customers designated as at fair value through profit or loss attributable to changes in credit risk was a £5 million credit for the year and cumulatively
a credit of £3 million (2012 - £22 million credit, cumulative £44 million credit; 2011 - £31 million charge, cumulative £71 million credit).
(3) Includes items in the course of transmission to other banks of £828 million (2012 - £521 million; 2011 - £506 million).
(4) The carrying amount of other customer accounts designated as at fair value through profit or loss is £412 million (2012 - £305 million; 2011 - £166 million) higher than the principal amount. No
amounts have been recognised in profit or loss for changes in credit risk associated with these liabilities as the changes are immaterial, measured as the change in fair value from movements in the
period in the credit risk premium payable. The amounts include investment contracts with a carrying value of nil (2012 - nil; 2011 - £38 million).
(5) Comprises bonds and medium term notes of £63,959 million (2012 - £88,723 million; 2011 - £129,780 million) and certificates of deposit and other commercial paper of £3,860 million (2012 - £5,869
million; 2011 - £32,841 million).
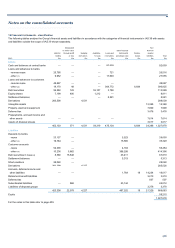
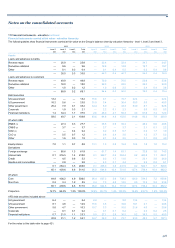
The tables below present information on financial assets and liabilities that are offset in the balance sheet under IFRS or subject to enforceable master
netting agreement together with financial collateral received or given.
Effect o
f
Net amount
master netting after the effect of
IFRS agreement/simila
r
Cash Other financial netting arrangements
Gross offse
t
Balance sheet agreements collateral collateral and related collateral
2013 £m £m £m £m £m £m £m
A
ssets
Derivatives 545,867 (265,709) 280,158 (242,836) (24,288) (5,990) 7,044
Reverse repurchase agreements 115,715 (40,658) 75,057 (11,379) — (63,589) 89
Loans to customers 3,438 (3,438) — — — — —
Settlement balances 2,950 (2,672) 278 (262) — — 16
667,970 (312,477) 355,493 (254,477) (24,288) (69,579) 7,149
Liabilities
Derivatives 540,622 (262,656) 277,966 (242,836) (20,429) (5,202) 9,499
Repurchase agreements 120,639 (40,658) 79,981 (11,379) — (68,602) —
Customer accounts 6,491 (6,491) — — — — —
Settlement balances 3,682 (2,672) 1,010 (262) — — 748
671,434 (312,477) 358,957 (254,477) (20,429) (73,804) 10,247
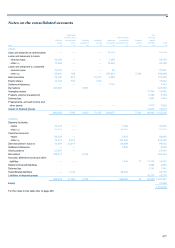
2012
A
ssets
Derivatives 801,606 (373,476) 428,130 (373,906) (34,099) (5,616) 14,509
Reverse repurchase agreements 139,120 (38,377) 100,743 (17,439) — (83,304) —
Loans to customers 1,748 (1,460) 288 — — — 288
Settlement balances 3,680 (2,456) 1,224 (345) — — 879
946,154 (415,769) 530,385 (391,690) (34,099) (88,920) 15,676
Liabilities
Derivatives 796,991 (373,476) 423,515 (373,906) (24,633) (8,264) 16,712
Repurchase agreements 163,500 (38,377) 125,123 (17,439) — (107,684) —
Customer accounts 1,897 (1,460) 437 — — — 437
Settlement balances 4,270 (2,456) 1,814 (345) — — 1,469
966,658 (415,769) 550,889 (391,690) (24,633) (115,948) 18,618