RBS 2013 Annual Report Download - page 334
Download and view the complete annual report
Please find page 334 of the 2013 RBS annual report below. You can navigate through the pages in the report by either clicking on the pages listed below, or by using the keyword search tool below to find specific information within the annual report.-
 1
1 -
2
-
3
-
4
-
5
-
6
-
7
-
8
-
9
-
10
-
11
-
12
-
13
-
14
-
15
-
16
-
17
-
18
-
19
-
20
-
21
-
22
-
23
-
24
-
25
-
26
-
27
-
28
-
29
-
30
-
31
-
32
-
33
-
34
-
35
-
36
-
37
-
38
-
39
-
40
-
41
-
42
-
43
-
44
-
45
-
46
-
47
-
48
-
49
-
50
-
51
-
52
-
53
-
54
-
55
-
56
-
57
-
58
-
59
-
60
-
61
-
62
-
63
-
64
-
65
-
66
-
67
-
68
-
69
-
70
-
71
-
72
-
73
-
74
-
75
-
76
-
77
-
78
-
79
-
80
-
81
-
82
-
83
-
84
-
85
-
86
-
87
-
88
-
89
-
90
-
91
-
92
-
93
-
94
-
95
-
96
-
97
-
98
-
99
-
100
-
101
-
102
-
103
-
104
-
105
-
106
-
107
-
108
-
109
-
110
-
111
-
112
-
113
-
114
-
115
-
116
-
117
-
118
-
119
-
120
-
121
-
122
-
123
-
124
-
125
-
126
-
127
-
128
-
129
-
130
-
131
-
132
-
133
-
134
-
135
-
136
-
137
-
138
-
139
-
140
-
141
-
142
-
143
-
144
-
145
-
146
-
147
-
148
-
149
-
150
-
151
-
152
-
153
-
154
-
155
-
156
-
157
-
158
-
159
-
160
-
161
-
162
-
163
-
164
-
165
-
166
-
167
-
168
-
169
-
170
-
171
-
172
-
173
-
174
-
175
-
176
-
177
-
178
-
179
-
180
-
181
-
182
-
183
-
184
-
185
-
186
-
187
-
188
-
189
-
190
-
191
-
192
-
193
-
194
-
195
-
196
-
197
-
198
-
199
-
200
-
201
-
202
-
203
-
204
-
205
-
206
-
207
-
208
-
209
-
210
-
211
-
212
-
213
-
214
-
215
-
216
-
217
-
218
-
219
-
220
-
221
-
222
-
223
-
224
-
225
-
226
-
227
-
228
-
229
-
230
-
231
-
232
-
233
-
234
-
235
-
236
-
237
-
238
-
239
-
240
-
241
-
242
-
243
-
244
-
245
-
246
-
247
-
248
-
249
-
250
-
251
-
252
-
253
-
254
-
255
-
256
-
257
-
258
-
259
-
260
-
261
-
262
-
263
-
264
-
265
-
266
-
267
-
268
-
269
-
270
-
271
-
272
-
273
-
274
-
275
-
276
-
277
-
278
-
279
-
280
-
281
-
282
-
283
-
284
-
285
-
286
-
287
-
288
-
289
-
290
-
291
-
292
-
293
-
294
-
295
-
296
-
297
-
298
-
299
-
300
-
301
-
302
-
303
-
304
-
305
-
306
-
307
-
308
-
309
-
310
-
311
-
312
-
313
-
314
-
315
-
316
-
317
-
318
-
319
-
320
-
321
-
322
-
323
-
 324
324 -
 325
325 -
 326
326 -
 327
327 -
 328
328 -
 329
329 -
 330
330 -
 331
331 -
 332
332 -
 333
333 -
 334
334 -
 335
335 -
 336
336 -
 337
337 -
 338
338 -
 339
339 -
 340
340 -
 341
341 -
 342
342 -
 343
343 -
 344
344 -
345
-
346
-
347
-
348
-
349
-
350
-
351
-
352
-
353
-
354
-
355
-
356
-
357
-
358
-
359
-
360
-
361
-
362
-
363
-
364
-
365
-
366
-
367
-
368
-
369
-
370
-
371
-
372
-
373
-
374
-
375
-
376
-
377
-
378
-
379
-
380
-
381
-
382
-
383
-
384
-
385
-
386
-
387
-
388
-
389
-
390
-
391
-
392
-
393
-
394
-
395
-
396
-
397
-
398
-
399
-
400
-
401
-
402
-
403
-
404
-
405
-
406
-
407
-
408
-
409
-
410
-
411
-
412
-
413
-
414
-
415
-
416
-
417
-
418
-
419
-
420
-
421
-
422
-
423
-
424
-
425
-
426
-
427
-
428
-
429
-
430
-
431
-
432
-
433
-
434
-
435
-
436
-
437
-
438
-
439
-
440
-
441
-
442
-
443
-
444
-
445
-
446
-
447
-
448
-
449
-
450
-
451
-
452
-
453
-
454
-
455
-
456
-
457
-
458
-
459
-
460
-
461
-
462
-
463
-
464
-
465
-
466
-
467
-
468
-
469
-
470
-
471
-
472
-
473
-
474
-
475
-
476
-
477
-
478
-
479
-
480
-
481
-
482
-
483
-
484
-
485
-
486
-
487
-
488
-
489
-
490
-
491
-
492
-
493
-
494
-
495
-
496
-
497
-
498
-
499
-
500
-
501
-
502
-
503
-
504
-
505
-
506
-
507
-
508
-
509
-
510
-
511
-
512
-
513
-
514
-
515
-
516
-
517
-
518
-
519
-
520
-
521
-
522
-
523
-
524
-
525
-
526
-
527
-
528
-
529
-
530
-
531
-
532
-
533
-
534
-
535
-
536
-
537
-
538
-
539
-
540
-
541
-
542
-
543
-
544
-
545
-
546
-
547
-
548
-
549
-
550
-
551
-
552
-
553
-
554
-
555
-
556
-
557
-
558
-
559
-
560
-
561
-
562
-
563
-
564
 |
 |

Business review Risk and balance sheet management
332
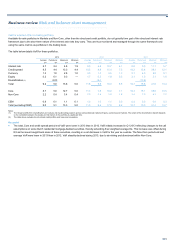
Market risk continued
Traded market risk continued
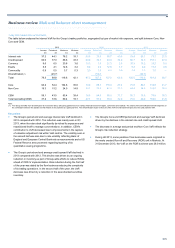
Market risk capital*
Minimum capital requirements
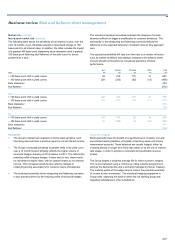
The following table analyses the market risk minimum capital requirement, calculated in accordance with Basel 2.5.
2013 2012 2011
£m £m £m
Interest rate position risk requirement 147 254 1,107
Equity position risk requirement 1 1 3
Option position risk requirement 10 26 26
Commodity position risk requirement 13 2 2
Foreign currency position risk requirement 39 12 10
Specific interest rate risk of securitisation positions 123 156 250
Total (standard method) 333 451 1,398
Pillar 1 model based position risk requirement 2,086 2,959 3,725
Total market risk minimum capital requirement 2,419 3,410 5,123
The following table analyses the principal contributors to the Pillar 1 model based position risk requirement presented in the previous table.
2013
Average (1) Maximum (1) Minimum (1) Period end 2012 2011
£m £m £m £m £m £m
Value-at-risk (VaR) (1) 745 875 564 576 825 887
Stressed VaR (SVaR) 1,056 1,266 830 841 1,226 1,682
Incremental risk charge (IRC) 390 458 279 443 467 469
A
ll price risk (APR) 11 13 8 8 12 297
Risk not in VaR (RNIV) 286 433 179 218 429 390
Notes:
(1) The average, maximum and minimum positions are based on the monthly Pillar 1 model based capital requirements.
(2) All items are expressed in capital requirement terms.
Key points
• The Group’s total market risk minimum capital requirement fell in
2013, largely driven by the Pillar 1 model-based contributors
(primarily VaR, SVaR and RNIV). The standard method requirement
also fell, driven by the interest rate position risk requirement and the
specific interest rate risk of securitisation positions.
• The interest rate position risk requirement decreased, primarily due
to the migration to VaR of certain trades, the maturity or closing of
other trades and a reduction in unmatched positions.
• The option position risk requirement fell, driven by an increased
impact of netting for some types of options. This was partially offset
by the inclusion of some emerging market trades in the calculation
as part of the migration of portfolios from RBS NV to RBS plc.
• The foreign currency position risk requirement increased, reflecting
accelerated impairments on euro denominated assets in RBS
Capital Resolution (RCR).
• Specific interest rate risk of securitisation positions: This charge
decreased due to the disposal of assets, primarily in the AAA and
BB rating categories, during the year.
*unaudited
• The decline in the VaR and SVaR based charges was driven by
significant de-risking of rates exposure in RBS plc in the first half of
the year. In addition, the improved capture of valuation adjustments
in CEM accompanied by market data improvements drove a further
reduction in these charges, particularly during the second half of the
year.
• The IRC contribution to the Pillar 1 model based position risk
requirement was broadly unchanged. This differs from the figures
presented in the IRC table on page 333 for the reasons explained in
the note to that table. For more commentary on the IRC, see that
table.
• The decrease in the APR charge was due to the maturing of trades,
with significant reductions in the final quarter.
• For details on the drivers of the decline in the RNIV charge, see the
commentary on page 329.