RBS 2013 Annual Report Download - page 425
Download and view the complete annual report
Please find page 425 of the 2013 RBS annual report below. You can navigate through the pages in the report by either clicking on the pages listed below, or by using the keyword search tool below to find specific information within the annual report.-
 1
1 -
2
-
3
-
4
-
5
-
6
-
7
-
8
-
9
-
10
-
11
-
12
-
13
-
14
-
15
-
16
-
17
-
18
-
19
-
20
-
21
-
22
-
23
-
24
-
25
-
26
-
27
-
28
-
29
-
30
-
31
-
32
-
33
-
34
-
35
-
36
-
37
-
38
-
39
-
40
-
41
-
42
-
43
-
44
-
45
-
46
-
47
-
48
-
49
-
50
-
51
-
52
-
53
-
54
-
55
-
56
-
57
-
58
-
59
-
60
-
61
-
62
-
63
-
64
-
65
-
66
-
67
-
68
-
69
-
70
-
71
-
72
-
73
-
74
-
75
-
76
-
77
-
78
-
79
-
80
-
81
-
82
-
83
-
84
-
85
-
86
-
87
-
88
-
89
-
90
-
91
-
92
-
93
-
94
-
95
-
96
-
97
-
98
-
99
-
100
-
101
-
102
-
103
-
104
-
105
-
106
-
107
-
108
-
109
-
110
-
111
-
112
-
113
-
114
-
115
-
116
-
117
-
118
-
119
-
120
-
121
-
122
-
123
-
124
-
125
-
126
-
127
-
128
-
129
-
130
-
131
-
132
-
133
-
134
-
135
-
136
-
137
-
138
-
139
-
140
-
141
-
142
-
143
-
144
-
145
-
146
-
147
-
148
-
149
-
150
-
151
-
152
-
153
-
154
-
155
-
156
-
157
-
158
-
159
-
160
-
161
-
162
-
163
-
164
-
165
-
166
-
167
-
168
-
169
-
170
-
171
-
172
-
173
-
174
-
175
-
176
-
177
-
178
-
179
-
180
-
181
-
182
-
183
-
184
-
185
-
186
-
187
-
188
-
189
-
190
-
191
-
192
-
193
-
194
-
195
-
196
-
197
-
198
-
199
-
200
-
201
-
202
-
203
-
204
-
205
-
206
-
207
-
208
-
209
-
210
-
211
-
212
-
213
-
214
-
215
-
216
-
217
-
218
-
219
-
220
-
221
-
222
-
223
-
224
-
225
-
226
-
227
-
228
-
229
-
230
-
231
-
232
-
233
-
234
-
235
-
236
-
237
-
238
-
239
-
240
-
241
-
242
-
243
-
244
-
245
-
246
-
247
-
248
-
249
-
250
-
251
-
252
-
253
-
254
-
255
-
256
-
257
-
258
-
259
-
260
-
261
-
262
-
263
-
264
-
265
-
266
-
267
-
268
-
269
-
270
-
271
-
272
-
273
-
274
-
275
-
276
-
277
-
278
-
279
-
280
-
281
-
282
-
283
-
284
-
285
-
286
-
287
-
288
-
289
-
290
-
291
-
292
-
293
-
294
-
295
-
296
-
297
-
298
-
299
-
300
-
301
-
302
-
303
-
304
-
305
-
306
-
307
-
308
-
309
-
310
-
311
-
312
-
313
-
314
-
315
-
316
-
317
-
318
-
319
-
320
-
321
-
322
-
323
-
324
-
325
-
326
-
327
-
328
-
329
-
330
-
331
-
332
-
333
-
334
-
335
-
336
-
337
-
338
-
339
-
340
-
341
-
342
-
343
-
344
-
345
-
346
-
347
-
348
-
349
-
350
-
351
-
352
-
353
-
354
-
355
-
356
-
357
-
358
-
359
-
360
-
361
-
362
-
363
-
364
-
365
-
366
-
367
-
368
-
369
-
370
-
371
-
372
-
373
-
374
-
375
-
376
-
377
-
378
-
379
-
380
-
381
-
382
-
383
-
384
-
385
-
386
-
387
-
388
-
389
-
390
-
391
-
392
-
393
-
394
-
395
-
396
-
397
-
398
-
399
-
400
-
401
-
402
-
403
-
404
-
405
-
406
-
407
-
408
-
409
-
410
-
411
-
412
-
413
-
414
-
 415
415 -
 416
416 -
 417
417 -
 418
418 -
 419
419 -
 420
420 -
 421
421 -
 422
422 -
 423
423 -
 424
424 -
 425
425 -
 426
426 -
 427
427 -
 428
428 -
 429
429 -
 430
430 -
 431
431 -
 432
432 -
 433
433 -
 434
434 -
 435
435 -
436
-
437
-
438
-
439
-
440
-
441
-
442
-
443
-
444
-
445
-
446
-
447
-
448
-
449
-
450
-
451
-
452
-
453
-
454
-
455
-
456
-
457
-
458
-
459
-
460
-
461
-
462
-
463
-
464
-
465
-
466
-
467
-
468
-
469
-
470
-
471
-
472
-
473
-
474
-
475
-
476
-
477
-
478
-
479
-
480
-
481
-
482
-
483
-
484
-
485
-
486
-
487
-
488
-
489
-
490
-
491
-
492
-
493
-
494
-
495
-
496
-
497
-
498
-
499
-
500
-
501
-
502
-
503
-
504
-
505
-
506
-
507
-
508
-
509
-
510
-
511
-
512
-
513
-
514
-
515
-
516
-
517
-
518
-
519
-
520
-
521
-
522
-
523
-
524
-
525
-
526
-
527
-
528
-
529
-
530
-
531
-
532
-
533
-
534
-
535
-
536
-
537
-
538
-
539
-
540
-
541
-
542
-
543
-
544
-
545
-
546
-
547
-
548
-
549
-
550
-
551
-
552
-
553
-
554
-
555
-
556
-
557
-
558
-
559
-
560
-
561
-
562
-
563
-
564
 |
 |

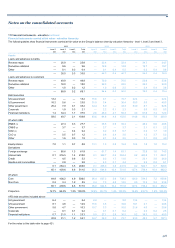
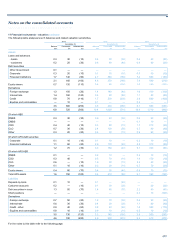
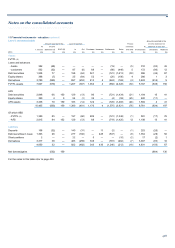
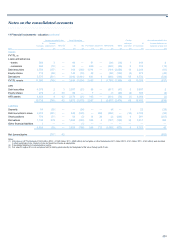
Notes on the consolidated accounts
423
Notes:
(1) Level 3 structured issued debt securities of £1.3 billion are not included in the table above as valuation is consistent with the valuation of the embedded derivative component.
(2) Price and yield: There may be a range of price based information used for evaluating the value of an instrument. This may be a direct comparison of one instrument or portfolio with another or
movements in a more liquid instrument may be used to indicate the movement in the value of less liquid instrument. The comparison may also be indirect in that adjustments are made to the price to
reflect differences between the pricing source and the instrument being valued, for example different maturity, credit quality, seniority or expected payouts. Similarly to price, an instrument’s yield may
be compared to other instruments either directly or indirectly. Prices move inversely to yields.
(3) Credit spreads and discount margins: Credit spreads and margins express the return required over a benchmark rate or index to compensate for the credit risk associated with a cash instrument. A
higher credit spread would indicate that the underlying instrument has more credit risk associated with it. Consequently, investors require a higher yield to compensate for the higher risk. The
discount rate comprises credit spread or margin plus the benchmark rate; it is used to value future cash flows.
(4) Recovery rate: Reflects market expectations about the return of principal for a debt instrument or other obligations after a credit event or on liquidation. Recovery rates tend to move conversely to
credit spreads.
(5) Probability of default: This is a measure of the expected rate of losses in an underlying portfolio of mortgages or other receivables. The higher the probability of default the lower the value of the
underlying portfolio. The cumulative losses tend to move conversely to prepayment rates and in line with constant default rates. The higher the rate, the higher the expected number of defaults and
therefore the expected losses. An increase in the default rate is likely to reduce the value of an asset.
(6) Volatility: A measure of the tendency of a price to change with time.
(7) Conditional prepayment rate: The measure of the rate at which underlying mortgages or loans are prepaid. An increase in prepayment rates in a portfolio may increase or decrease its value
depending upon the credit quality and payment terms of the underlying loans. For example an increase in prepayment rate of a portfolio of high credit quality underlying assets may reduce the value
and size of the portfolio whereas for lower credit quality underlyings it may increase the value.
(8) EBITDA (earnings before interest, tax, depreciation and amortisation) multiple: This is a commonly used valuation technique for equity holdings. The EBITDA of a company is used as a proxy for the
future cash flows and when multiplied by an appropriate factor gives an estimate for the value of the company.
(9) Correlation: Measures the degree by which two prices or other variables are observed to move together. If they move in the same direction there is positive correlation; if they move in opposite
directions there is negative correlation. Correlations typically include relationships between: default probabilities of assets in a basket (a group of separate assets), exchange rates, interest rates and
other financial variables.
(10) Upfront points: These are similar to credit spreads in that a higher figure is a measure of increased credit risk. A credit derivative price can be quoted on either credit spread or upfront points basis
and the two can be considered a near equivalent from a risk perspective. As with credit spreads higher upfront points indicate that the underlying entity has a higher credit risk associated with it.
(11) The Group does not have any material liabilities measured at fair value that are issued with an inseparable third party credit enhancement.
The level 3 sensitivities above are calculated at a trade or low level
portfolio basis. They are not calculated on an overall portfolio basis and
therefore do not reflect the likely overall potential uncertainty on the
whole portfolio. The figures are aggregated and do not reflect the
correlated nature of some of the sensitivities. In particular, for some of the
portfolios the sensitivities may be negatively correlated where a
downwards movement in one asset would produce an upwards
movement in another, but due to the additive presentation of the above
figures this correlation cannot be displayed. The actual potential
downside sensitivity of the total portfolio may be less than the non-
correlated sum of the additive figures as shown in the above table.
Judgmental issues
The diverse range of products traded by the Group results in a wide
range of instruments that are classified into level 3 of the hierarchy.
Whilst the majority of these instruments naturally fall into a particular
level, for some products an element of judgment is required. The majority
of the Group’s financial instruments carried at fair value are classified as
level 2: inputs are observable either directly (i.e. as a price) or indirectly
(i.e. derived from prices).
Active and inactive markets
A key input in the decision making process for the allocation of assets to
a particular level is liquidity. In general, the degree of valuation
uncertainty depends on the degree of liquidity of an input. For example, a
derivative can be placed into level 2 or level 3 dependent upon the
liquidity of level 3 inputs.
Where markets are liquid or very liquid, little judgment is required.
However, when the information regarding the liquidity in a particular
market is not clear, a judgment may need to be made. This can be made
more difficult as assessing the liquidity of a market may not always be
straightforward. For an equity traded on an exchange, daily volumes of
trading can be seen, but for an over-the counter (OTC) derivative
assessing the liquidity of the market with no central exchange can be
more difficult.
A key related issue is where a market moves from liquid to illiquid or vice
versa. Where this change is considered to be temporary, the
classification is not changed. For example, if there is little market trading
in a product on a reporting date but at the previous reporting date and
during the intervening period the market has been considered to be
liquid, the instrument will continue to be classified in the same level in the
hierarchy. This is to provide consistency so that transfers between levels
are driven by genuine changes in market liquidity and do not reflect short
term or seasonal effects.
Interaction with the IPV process
The determination of an instrument’s level cannot be made at a global
product level as a single product type can be in more than one level. For
example, a single name corporate credit default swap could be in level 2
or level 3 depending on whether the reference counterparty is liquid or
illiquid.