RBS 2013 Annual Report Download - page 350
Download and view the complete annual report
Please find page 350 of the 2013 RBS annual report below. You can navigate through the pages in the report by either clicking on the pages listed below, or by using the keyword search tool below to find specific information within the annual report.-
 1
1 -
2
-
3
-
4
-
5
-
6
-
7
-
8
-
9
-
10
-
11
-
12
-
13
-
14
-
15
-
16
-
17
-
18
-
19
-
20
-
21
-
22
-
23
-
24
-
25
-
26
-
27
-
28
-
29
-
30
-
31
-
32
-
33
-
34
-
35
-
36
-
37
-
38
-
39
-
40
-
41
-
42
-
43
-
44
-
45
-
46
-
47
-
48
-
49
-
50
-
51
-
52
-
53
-
54
-
55
-
56
-
57
-
58
-
59
-
60
-
61
-
62
-
63
-
64
-
65
-
66
-
67
-
68
-
69
-
70
-
71
-
72
-
73
-
74
-
75
-
76
-
77
-
78
-
79
-
80
-
81
-
82
-
83
-
84
-
85
-
86
-
87
-
88
-
89
-
90
-
91
-
92
-
93
-
94
-
95
-
96
-
97
-
98
-
99
-
100
-
101
-
102
-
103
-
104
-
105
-
106
-
107
-
108
-
109
-
110
-
111
-
112
-
113
-
114
-
115
-
116
-
117
-
118
-
119
-
120
-
121
-
122
-
123
-
124
-
125
-
126
-
127
-
128
-
129
-
130
-
131
-
132
-
133
-
134
-
135
-
136
-
137
-
138
-
139
-
140
-
141
-
142
-
143
-
144
-
145
-
146
-
147
-
148
-
149
-
150
-
151
-
152
-
153
-
154
-
155
-
156
-
157
-
158
-
159
-
160
-
161
-
162
-
163
-
164
-
165
-
166
-
167
-
168
-
169
-
170
-
171
-
172
-
173
-
174
-
175
-
176
-
177
-
178
-
179
-
180
-
181
-
182
-
183
-
184
-
185
-
186
-
187
-
188
-
189
-
190
-
191
-
192
-
193
-
194
-
195
-
196
-
197
-
198
-
199
-
200
-
201
-
202
-
203
-
204
-
205
-
206
-
207
-
208
-
209
-
210
-
211
-
212
-
213
-
214
-
215
-
216
-
217
-
218
-
219
-
220
-
221
-
222
-
223
-
224
-
225
-
226
-
227
-
228
-
229
-
230
-
231
-
232
-
233
-
234
-
235
-
236
-
237
-
238
-
239
-
240
-
241
-
242
-
243
-
244
-
245
-
246
-
247
-
248
-
249
-
250
-
251
-
252
-
253
-
254
-
255
-
256
-
257
-
258
-
259
-
260
-
261
-
262
-
263
-
264
-
265
-
266
-
267
-
268
-
269
-
270
-
271
-
272
-
273
-
274
-
275
-
276
-
277
-
278
-
279
-
280
-
281
-
282
-
283
-
284
-
285
-
286
-
287
-
288
-
289
-
290
-
291
-
292
-
293
-
294
-
295
-
296
-
297
-
298
-
299
-
300
-
301
-
302
-
303
-
304
-
305
-
306
-
307
-
308
-
309
-
310
-
311
-
312
-
313
-
314
-
315
-
316
-
317
-
318
-
319
-
320
-
321
-
322
-
323
-
324
-
325
-
326
-
327
-
328
-
329
-
330
-
331
-
332
-
333
-
334
-
335
-
336
-
337
-
338
-
339
-
 340
340 -
 341
341 -
 342
342 -
 343
343 -
 344
344 -
 345
345 -
 346
346 -
 347
347 -
 348
348 -
 349
349 -
 350
350 -
 351
351 -
 352
352 -
 353
353 -
 354
354 -
 355
355 -
 356
356 -
 357
357 -
 358
358 -
 359
359 -
 360
360 -
361
-
362
-
363
-
364
-
365
-
366
-
367
-
368
-
369
-
370
-
371
-
372
-
373
-
374
-
375
-
376
-
377
-
378
-
379
-
380
-
381
-
382
-
383
-
384
-
385
-
386
-
387
-
388
-
389
-
390
-
391
-
392
-
393
-
394
-
395
-
396
-
397
-
398
-
399
-
400
-
401
-
402
-
403
-
404
-
405
-
406
-
407
-
408
-
409
-
410
-
411
-
412
-
413
-
414
-
415
-
416
-
417
-
418
-
419
-
420
-
421
-
422
-
423
-
424
-
425
-
426
-
427
-
428
-
429
-
430
-
431
-
432
-
433
-
434
-
435
-
436
-
437
-
438
-
439
-
440
-
441
-
442
-
443
-
444
-
445
-
446
-
447
-
448
-
449
-
450
-
451
-
452
-
453
-
454
-
455
-
456
-
457
-
458
-
459
-
460
-
461
-
462
-
463
-
464
-
465
-
466
-
467
-
468
-
469
-
470
-
471
-
472
-
473
-
474
-
475
-
476
-
477
-
478
-
479
-
480
-
481
-
482
-
483
-
484
-
485
-
486
-
487
-
488
-
489
-
490
-
491
-
492
-
493
-
494
-
495
-
496
-
497
-
498
-
499
-
500
-
501
-
502
-
503
-
504
-
505
-
506
-
507
-
508
-
509
-
510
-
511
-
512
-
513
-
514
-
515
-
516
-
517
-
518
-
519
-
520
-
521
-
522
-
523
-
524
-
525
-
526
-
527
-
528
-
529
-
530
-
531
-
532
-
533
-
534
-
535
-
536
-
537
-
538
-
539
-
540
-
541
-
542
-
543
-
544
-
545
-
546
-
547
-
548
-
549
-
550
-
551
-
552
-
553
-
554
-
555
-
556
-
557
-
558
-
559
-
560
-
561
-
562
-
563
-
564
 |
 |

Business review Risk and balance sheet management
348
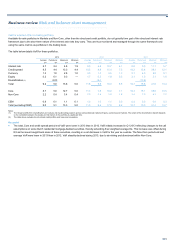
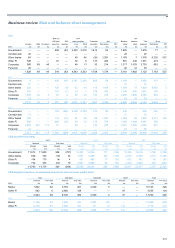
Country risk continued
Country exposure continued
• Eurozone periphery - despite the appreciation of the euro against
sterling, balance sheet exposure decreased to £52.9 billion, a
reduction of £6.6 billion or 11%, in nearly all countries, as follows:
° Ireland - exposure decreased by £2.1 billion to £37.0 billion, in
all broad product categories. Residential and commercial real
estate lending declined slightly to £16.9 billion and £10.3
billion, respectively. Provisions increased by £2.8 billion, most
of which related to corporate lending.
° Spain - Group Treasury’s holdings of covered bonds (cedulas)
decreased by £0.7 billion due to sales in improved market
conditions. Corporate lending decreased by £1.3 billion to £2.9
billion, with commercial real estate lending more than halving,
largely as a result of disposals in Non-Core, to £0.8 billion.
° Italy - the £1.3 billion decrease in exposure to £5.2 billion
reflected reductions in lending and derivatives to corporate
clients. Net HFT debt exposure fluctuates as the Group is a
market-maker in Italian government bonds. Off-balance sheet
exposure to corporates and non-bank financial institutions also
declined, by £0.7 billion.
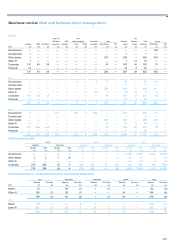
° Portugal - exposure declined further by £0.4 billion to £0.9
billion. The remaining exposure mainly consisted of corporate
lending to a few large highly creditworthy clients and
collateralised derivatives trading with the largest local banks.
° Greece - exposure decreased by £0.2 billion to £0.4 billion,
caused by reductions in lending and derivatives. The
remaining exposure comprised mostly of collateralised
derivatives exposure to banks and corporate lending, including
exposure to local subsidiaries of international companies.
° Cyprus - exposure increased slightly to £0.2 billion, most of
which was covered by parental and export credit agency
guarantees from elsewhere.
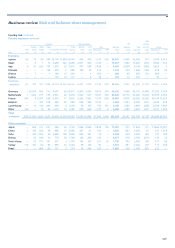
• Germany - balance sheet exposure decreased from £48.4 billion to
£23.9 billion principally owing to a £16.4 billion reduction in cash
balances held with the central bank. AFS government bonds
decreased by £4.1 billion in line with treasury management
strategies. Lending to corporate clients decreased by £1.1 billion,
principally in the commercial real estate, oil and gas, and media
sectors.
*unaudited
• Netherlands - balance sheet exposure decreased from £23.6 billion
to £16.1 billion. AFS debt securities issued by non-bank financial
institutions declined by £2.8 billion, primarily following repayments.
Corporate lending decreased by £0.8 billion, primarily in commercial
real estate. Off-balance sheet exposure to corporate clients
decreased by £1.1 billion, mainly in the telecommunications, retail
and food and consumer sectors.
• France - balance sheet exposure decreased from £19.7 billion to
£14.0 billion. The net long HFT position in government bonds
declined by £1.9 billion in the course of normal trading in the rates
business.
• Japan - balance sheet exposure decreased by £6.0 billion to £5.3
billion. Net HFT and AFS government bonds fell by £5.1 billion and
£1.5 billion, respectively, and derivatives exposure, largely to banks,
decreased by £0.5 billion. This reflected depreciation of the yen,
lower trading flows and a reduction in Japanese bonds held as
derivatives collateral. Lending to the central bank increased by £0.8
billion.
• China - lending to banks increased by £1.8 billion to £2.8 billion.
Corporate lending rose by £0.5 billion to £1.5 billion, reflecting
customer demand. Derivatives exposure to public sector entities
decreased by £0.5 billion to £0.4 billion owing to fluctuations in
short-term hedging by clients.
• India - balance sheet exposure decreased by £1.3 billion to £3.8
billion, driven largely by reductions in lending to banks and to the
telecommunications and oil and gas sectors.
• CDS positions - the Group approximately halved its European CDS
positions by consolidating its derivatives portfolio through contract
terminations to reduce risks and capital requirements in line with
strategic plans, while maturities reduced the positions further. This
resulted in major reductions in the gross notional value of CDS
protection bought and sold. Net bought protection in terms of CDS
notional less fair value, also fell by £1.2 billion to £5.6 billion, with
reductions particularly in the Netherlands and France.
• Funding mismatches - the estimated funding mismatch at risk of
redenomination for Ireland was £6.5 billion at the end of the year,
falling from £9.0 billion a year before due to an increase in
provisions and a reduction in assets. The mismatch for Spain was
£6.5 billion, up from £4.5 billion as the Group reduced its local
funding (and associated cost) given the improved outlook for the
country. The net position for Italy fell to £0.5 billion from £1.0 billion.
The net positions for Portugal, Greece and Cyprus were all minimal.
Overall, perceived risks of redenomination events in the eurozone
declined considerably in 2013.