RBS 2013 Annual Report Download - page 138
Download and view the complete annual report
Please find page 138 of the 2013 RBS annual report below. You can navigate through the pages in the report by either clicking on the pages listed below, or by using the keyword search tool below to find specific information within the annual report.-
 1
1 -
2
-
3
-
4
-
5
-
6
-
7
-
8
-
9
-
10
-
11
-
12
-
13
-
14
-
15
-
16
-
17
-
18
-
19
-
20
-
21
-
22
-
23
-
24
-
25
-
26
-
27
-
28
-
29
-
30
-
31
-
32
-
33
-
34
-
35
-
36
-
37
-
38
-
39
-
40
-
41
-
42
-
43
-
44
-
45
-
46
-
47
-
48
-
49
-
50
-
51
-
52
-
53
-
54
-
55
-
56
-
57
-
58
-
59
-
60
-
61
-
62
-
63
-
64
-
65
-
66
-
67
-
68
-
69
-
70
-
71
-
72
-
73
-
74
-
75
-
76
-
77
-
78
-
79
-
80
-
81
-
82
-
83
-
84
-
85
-
86
-
87
-
88
-
89
-
90
-
91
-
92
-
93
-
94
-
95
-
96
-
97
-
98
-
99
-
100
-
101
-
102
-
103
-
104
-
105
-
106
-
107
-
108
-
109
-
110
-
111
-
112
-
113
-
114
-
115
-
116
-
117
-
118
-
119
-
120
-
121
-
122
-
123
-
124
-
125
-
126
-
127
-
 128
128 -
 129
129 -
 130
130 -
 131
131 -
 132
132 -
 133
133 -
 134
134 -
 135
135 -
 136
136 -
 137
137 -
 138
138 -
 139
139 -
 140
140 -
 141
141 -
 142
142 -
 143
143 -
 144
144 -
 145
145 -
 146
146 -
 147
147 -
 148
148 -
149
-
150
-
151
-
152
-
153
-
154
-
155
-
156
-
157
-
158
-
159
-
160
-
161
-
162
-
163
-
164
-
165
-
166
-
167
-
168
-
169
-
170
-
171
-
172
-
173
-
174
-
175
-
176
-
177
-
178
-
179
-
180
-
181
-
182
-
183
-
184
-
185
-
186
-
187
-
188
-
189
-
190
-
191
-
192
-
193
-
194
-
195
-
196
-
197
-
198
-
199
-
200
-
201
-
202
-
203
-
204
-
205
-
206
-
207
-
208
-
209
-
210
-
211
-
212
-
213
-
214
-
215
-
216
-
217
-
218
-
219
-
220
-
221
-
222
-
223
-
224
-
225
-
226
-
227
-
228
-
229
-
230
-
231
-
232
-
233
-
234
-
235
-
236
-
237
-
238
-
239
-
240
-
241
-
242
-
243
-
244
-
245
-
246
-
247
-
248
-
249
-
250
-
251
-
252
-
253
-
254
-
255
-
256
-
257
-
258
-
259
-
260
-
261
-
262
-
263
-
264
-
265
-
266
-
267
-
268
-
269
-
270
-
271
-
272
-
273
-
274
-
275
-
276
-
277
-
278
-
279
-
280
-
281
-
282
-
283
-
284
-
285
-
286
-
287
-
288
-
289
-
290
-
291
-
292
-
293
-
294
-
295
-
296
-
297
-
298
-
299
-
300
-
301
-
302
-
303
-
304
-
305
-
306
-
307
-
308
-
309
-
310
-
311
-
312
-
313
-
314
-
315
-
316
-
317
-
318
-
319
-
320
-
321
-
322
-
323
-
324
-
325
-
326
-
327
-
328
-
329
-
330
-
331
-
332
-
333
-
334
-
335
-
336
-
337
-
338
-
339
-
340
-
341
-
342
-
343
-
344
-
345
-
346
-
347
-
348
-
349
-
350
-
351
-
352
-
353
-
354
-
355
-
356
-
357
-
358
-
359
-
360
-
361
-
362
-
363
-
364
-
365
-
366
-
367
-
368
-
369
-
370
-
371
-
372
-
373
-
374
-
375
-
376
-
377
-
378
-
379
-
380
-
381
-
382
-
383
-
384
-
385
-
386
-
387
-
388
-
389
-
390
-
391
-
392
-
393
-
394
-
395
-
396
-
397
-
398
-
399
-
400
-
401
-
402
-
403
-
404
-
405
-
406
-
407
-
408
-
409
-
410
-
411
-
412
-
413
-
414
-
415
-
416
-
417
-
418
-
419
-
420
-
421
-
422
-
423
-
424
-
425
-
426
-
427
-
428
-
429
-
430
-
431
-
432
-
433
-
434
-
435
-
436
-
437
-
438
-
439
-
440
-
441
-
442
-
443
-
444
-
445
-
446
-
447
-
448
-
449
-
450
-
451
-
452
-
453
-
454
-
455
-
456
-
457
-
458
-
459
-
460
-
461
-
462
-
463
-
464
-
465
-
466
-
467
-
468
-
469
-
470
-
471
-
472
-
473
-
474
-
475
-
476
-
477
-
478
-
479
-
480
-
481
-
482
-
483
-
484
-
485
-
486
-
487
-
488
-
489
-
490
-
491
-
492
-
493
-
494
-
495
-
496
-
497
-
498
-
499
-
500
-
501
-
502
-
503
-
504
-
505
-
506
-
507
-
508
-
509
-
510
-
511
-
512
-
513
-
514
-
515
-
516
-
517
-
518
-
519
-
520
-
521
-
522
-
523
-
524
-
525
-
526
-
527
-
528
-
529
-
530
-
531
-
532
-
533
-
534
-
535
-
536
-
537
-
538
-
539
-
540
-
541
-
542
-
543
-
544
-
545
-
546
-
547
-
548
-
549
-
550
-
551
-
552
-
553
-
554
-
555
-
556
-
557
-
558
-
559
-
560
-
561
-
562
-
563
-
564
 |
 |

Business review
136
UK Corporate continued
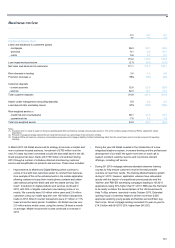
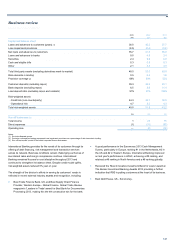
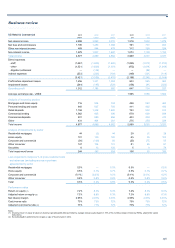
2013 2012 2011
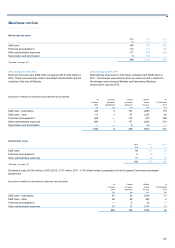
Performance ratios
Return on equity (1) 7.9% 14.5% 15.2%
Net interest margin 3.07% 3.06% 3.06%
Cost:income ratio 50% 44% 44%
Capital and balance sheet £bn £bn £bn
Loans and advances to customers (gross)
- financial institutions 5.5 5.8 5.8
- hotels and restaurants 4.7 5.6 6.1
- housebuilding and construction 2.9 3.4 3.9
- manufacturing 4.2 4.7 4.7
- private sector education, health, social work, recreational and community services 8.5 8.7 8.7
- property 22.0 24.8 28.2
- wholesale and retail trade, repairs 8.2 8.5 8.7
- asset and invoice finance 11.7 11.2 10.4
- shipping 6.5 7.6 7.8
- other 28.3 26.7 26.4
102.5 107.0 110.7
Loan impairment provisions (2.8) (2.4) (2.1)
Net loans and advances to customers 99.7 104.6 108.6
Total third party assets 105.0 110.2 114.2
Risk elements in lending 6.2 5.5 5.0
Provision coverage (2) 46% 45% 40%
Customer deposits 124.7 127.1 126.3
Loan:deposit ratio (excluding repos) 80% 82% 86%
Risk-weighted assets
- credit risk (non-counterparty) 77.7 77.7 71.2
- operational risk 8.4 8.6 8.1
Total risk-weighted assets 86.1 86.3 79.3
Notes:
(1) Divisional return on equity is based on divisional operating profit after tax, divided by average notional equity (based on 10% of the monthly average of divisional RWAs, adjusted for capital
deductions).
(2) Provision coverage percentage represents loan impairment provisions as a percentage of risk elements in lending.
2013 was a year in which UK Corporate underlined its commitment to
support the UK economy and played an active role in the communities it
operates in.
As part of this commitment the Bank appointed Sir Andrew Large to
undertake a thorough and independent review of the lending standards
and practices used by RBS and NatWest. UK Corporate will implement
all of the Independent Lending Review’s recommendations and is
adopting a revised strategy and capabilities to enhance support to SMEs
and the wider UK economic recovery while maintaining sound lending
practices.
As part of the division’s concerted effort to support its SME customers,
UK Corporate has been proactively reviewing the business needs of SME
customers to understand if they could benefit from the offer of additional
facilities. In 2013, over 12,000 customers were identified for additional
funding under UK Corporate’s 'Statements of Appetite' initiative. The
initiative resulted in approximately £6 billion of new funding being offered
to customers.
The division has continued to support the government-backed Funding
for Lending Scheme (FLS) and as at 31 December 2013 had allocated in
excess of £4.7 billion of new FLS-related lending to almost 25,000
customers, £3.1 billion of which has been drawn since the scheme was
launched. Mid-sized manufacturers are being offered targeted support,
with interest rates reduced by more than 1% in some cases. SME
customers benefited from both lower interest rates and the removal of
arrangement fees.