RBS 2013 Annual Report Download - page 335
Download and view the complete annual report
Please find page 335 of the 2013 RBS annual report below. You can navigate through the pages in the report by either clicking on the pages listed below, or by using the keyword search tool below to find specific information within the annual report.-
 1
1 -
2
-
3
-
4
-
5
-
6
-
7
-
8
-
9
-
10
-
11
-
12
-
13
-
14
-
15
-
16
-
17
-
18
-
19
-
20
-
21
-
22
-
23
-
24
-
25
-
26
-
27
-
28
-
29
-
30
-
31
-
32
-
33
-
34
-
35
-
36
-
37
-
38
-
39
-
40
-
41
-
42
-
43
-
44
-
45
-
46
-
47
-
48
-
49
-
50
-
51
-
52
-
53
-
54
-
55
-
56
-
57
-
58
-
59
-
60
-
61
-
62
-
63
-
64
-
65
-
66
-
67
-
68
-
69
-
70
-
71
-
72
-
73
-
74
-
75
-
76
-
77
-
78
-
79
-
80
-
81
-
82
-
83
-
84
-
85
-
86
-
87
-
88
-
89
-
90
-
91
-
92
-
93
-
94
-
95
-
96
-
97
-
98
-
99
-
100
-
101
-
102
-
103
-
104
-
105
-
106
-
107
-
108
-
109
-
110
-
111
-
112
-
113
-
114
-
115
-
116
-
117
-
118
-
119
-
120
-
121
-
122
-
123
-
124
-
125
-
126
-
127
-
128
-
129
-
130
-
131
-
132
-
133
-
134
-
135
-
136
-
137
-
138
-
139
-
140
-
141
-
142
-
143
-
144
-
145
-
146
-
147
-
148
-
149
-
150
-
151
-
152
-
153
-
154
-
155
-
156
-
157
-
158
-
159
-
160
-
161
-
162
-
163
-
164
-
165
-
166
-
167
-
168
-
169
-
170
-
171
-
172
-
173
-
174
-
175
-
176
-
177
-
178
-
179
-
180
-
181
-
182
-
183
-
184
-
185
-
186
-
187
-
188
-
189
-
190
-
191
-
192
-
193
-
194
-
195
-
196
-
197
-
198
-
199
-
200
-
201
-
202
-
203
-
204
-
205
-
206
-
207
-
208
-
209
-
210
-
211
-
212
-
213
-
214
-
215
-
216
-
217
-
218
-
219
-
220
-
221
-
222
-
223
-
224
-
225
-
226
-
227
-
228
-
229
-
230
-
231
-
232
-
233
-
234
-
235
-
236
-
237
-
238
-
239
-
240
-
241
-
242
-
243
-
244
-
245
-
246
-
247
-
248
-
249
-
250
-
251
-
252
-
253
-
254
-
255
-
256
-
257
-
258
-
259
-
260
-
261
-
262
-
263
-
264
-
265
-
266
-
267
-
268
-
269
-
270
-
271
-
272
-
273
-
274
-
275
-
276
-
277
-
278
-
279
-
280
-
281
-
282
-
283
-
284
-
285
-
286
-
287
-
288
-
289
-
290
-
291
-
292
-
293
-
294
-
295
-
296
-
297
-
298
-
299
-
300
-
301
-
302
-
303
-
304
-
305
-
306
-
307
-
308
-
309
-
310
-
311
-
312
-
313
-
314
-
315
-
316
-
317
-
318
-
319
-
320
-
321
-
322
-
323
-
324
-
 325
325 -
 326
326 -
 327
327 -
 328
328 -
 329
329 -
 330
330 -
 331
331 -
 332
332 -
 333
333 -
 334
334 -
 335
335 -
 336
336 -
 337
337 -
 338
338 -
 339
339 -
 340
340 -
 341
341 -
 342
342 -
 343
343 -
 344
344 -
 345
345 -
346
-
347
-
348
-
349
-
350
-
351
-
352
-
353
-
354
-
355
-
356
-
357
-
358
-
359
-
360
-
361
-
362
-
363
-
364
-
365
-
366
-
367
-
368
-
369
-
370
-
371
-
372
-
373
-
374
-
375
-
376
-
377
-
378
-
379
-
380
-
381
-
382
-
383
-
384
-
385
-
386
-
387
-
388
-
389
-
390
-
391
-
392
-
393
-
394
-
395
-
396
-
397
-
398
-
399
-
400
-
401
-
402
-
403
-
404
-
405
-
406
-
407
-
408
-
409
-
410
-
411
-
412
-
413
-
414
-
415
-
416
-
417
-
418
-
419
-
420
-
421
-
422
-
423
-
424
-
425
-
426
-
427
-
428
-
429
-
430
-
431
-
432
-
433
-
434
-
435
-
436
-
437
-
438
-
439
-
440
-
441
-
442
-
443
-
444
-
445
-
446
-
447
-
448
-
449
-
450
-
451
-
452
-
453
-
454
-
455
-
456
-
457
-
458
-
459
-
460
-
461
-
462
-
463
-
464
-
465
-
466
-
467
-
468
-
469
-
470
-
471
-
472
-
473
-
474
-
475
-
476
-
477
-
478
-
479
-
480
-
481
-
482
-
483
-
484
-
485
-
486
-
487
-
488
-
489
-
490
-
491
-
492
-
493
-
494
-
495
-
496
-
497
-
498
-
499
-
500
-
501
-
502
-
503
-
504
-
505
-
506
-
507
-
508
-
509
-
510
-
511
-
512
-
513
-
514
-
515
-
516
-
517
-
518
-
519
-
520
-
521
-
522
-
523
-
524
-
525
-
526
-
527
-
528
-
529
-
530
-
531
-
532
-
533
-
534
-
535
-
536
-
537
-
538
-
539
-
540
-
541
-
542
-
543
-
544
-
545
-
546
-
547
-
548
-
549
-
550
-
551
-
552
-
553
-
554
-
555
-
556
-
557
-
558
-
559
-
560
-
561
-
562
-
563
-
564
 |
 |

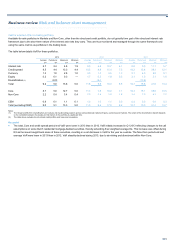
Business review Risk and balance sheet management
333
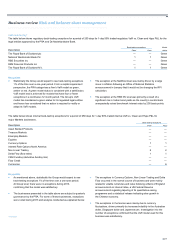
IRC by rating and product category
The following table analyses the IRC by rating and product.
Internal ratings (1)
AAA A
A
ABBB BB BCCC Total (1)
2013 £m £m £m £m £m £m £m £m
Product categories
Cash - ABS 31.4 — — 0.2 (1.5) 0.1 — 30.2
Cash - regular 73.5 15.5 7.2 132.3 21.4 2.9 33.9 286.7
Derivatives - credit (4.5) (1.2) (4.6) (21.4) (19.5) (13.4) (23.0) (87.6)
Derivatives - interest rate 29.7 5.4 0.6 165.5 5.8 0.6 — 207.6
Other 1.7 — — — — — — 1.7
Total 131.8 19.7 3.2 276.6 6.2 (9.8) 10.9 438.6
2012
Product categories
Cash - ABS 59.2 — — (0.1) (0.9) — — 58.2
Cash - regular 39.5 146.9 9.8 59.9 8.6 16.9 12.7 294.3
Derivatives - credit (0.3) (14.0) 4.0 30.4 28.4 5.6 (2.7) 51.4
Derivatives - interest rate (1.0) —1.5 0.1 (2.1) (0.3) — (1.8)
Other 13.8 — — — — — — 13.8
Total 111.2 132.9 15.3 90.3 34.0 22.2 10.0 415.9
Notes:
(1) Based on assessment of S&P, Moody’s and Fitch ratings, where available, or on the Group’s internal master grading scale.
(2) The figures presented are based on the spot IRC charge at 31 December 2013 and will therefore not agree with the IRC position risk requirement, as this is based on the 60-day average. The figures
presented above are in capital terms.
Key points
• The Group’s IRC was approximately £23 million or 6% higher at 31
December 2013 than one year previously. This rise was primarily
due to increased delta trading activity during the year, with
significant growth in positions in BBB-rated sovereign issuers
including Italy and Spain.
• By product category, the largest rise was in interest rate derivatives,
notably increased positions in BBB-rated Italian floating rate notes.
This was partly offset by a decrease in BB and BBB-rated credit
derivative products, principally CDS and Index CDS.
• A model parameter update at the end of 2013, chiefly incorporating
additional rating information from the previous 12 months, produced
an increased likelihood of certain counterparties being downgraded
and, thus, had a moderate upward impact on the charge.
Securitisation positions in the trading book
The following table shows the capital requirement for trading book securitisation positions by rating.
Ratings (1)
Non Investment Capital
AAA AA ABBB Grade Unrated Total (1,2) STD PRR (3) deductions
2013 £m £m £m £m £m £m £m %£m
Trading book securitisation charge 8.9 6.2 12.7 35.5 54.5 5.4 123.2 42.9 932.1
2012
Trading book securitisation charge 15.5 7.4 15.2 35.3 75.8 6.2 155.4 36.6 1,369.6
Notes:
(1) Based on S&P ratings.
(2) Excludes the capital deductions.
(3) Percentage of total standardised position risk requirement.
Key point
• The charge decreased in 2013, due to the disposal of assets, primarily in the AAA and BB rating categories, during the year.
*unaudited