RBS 2013 Annual Report Download - page 127
Download and view the complete annual report
Please find page 127 of the 2013 RBS annual report below. You can navigate through the pages in the report by either clicking on the pages listed below, or by using the keyword search tool below to find specific information within the annual report.-
 1
1 -
2
-
3
-
4
-
5
-
6
-
7
-
8
-
9
-
10
-
11
-
12
-
13
-
14
-
15
-
16
-
17
-
18
-
19
-
20
-
21
-
22
-
23
-
24
-
25
-
26
-
27
-
28
-
29
-
30
-
31
-
32
-
33
-
34
-
35
-
36
-
37
-
38
-
39
-
40
-
41
-
42
-
43
-
44
-
45
-
46
-
47
-
48
-
49
-
50
-
51
-
52
-
53
-
54
-
55
-
56
-
57
-
58
-
59
-
60
-
61
-
62
-
63
-
64
-
65
-
66
-
67
-
68
-
69
-
70
-
71
-
72
-
73
-
74
-
75
-
76
-
77
-
78
-
79
-
80
-
81
-
82
-
83
-
84
-
85
-
86
-
87
-
88
-
89
-
90
-
91
-
92
-
93
-
94
-
95
-
96
-
97
-
98
-
99
-
100
-
101
-
102
-
103
-
104
-
105
-
106
-
107
-
108
-
109
-
110
-
111
-
112
-
113
-
114
-
115
-
116
-
 117
117 -
 118
118 -
 119
119 -
 120
120 -
 121
121 -
 122
122 -
 123
123 -
 124
124 -
 125
125 -
 126
126 -
 127
127 -
 128
128 -
 129
129 -
 130
130 -
 131
131 -
 132
132 -
 133
133 -
 134
134 -
 135
135 -
 136
136 -
 137
137 -
138
-
139
-
140
-
141
-
142
-
143
-
144
-
145
-
146
-
147
-
148
-
149
-
150
-
151
-
152
-
153
-
154
-
155
-
156
-
157
-
158
-
159
-
160
-
161
-
162
-
163
-
164
-
165
-
166
-
167
-
168
-
169
-
170
-
171
-
172
-
173
-
174
-
175
-
176
-
177
-
178
-
179
-
180
-
181
-
182
-
183
-
184
-
185
-
186
-
187
-
188
-
189
-
190
-
191
-
192
-
193
-
194
-
195
-
196
-
197
-
198
-
199
-
200
-
201
-
202
-
203
-
204
-
205
-
206
-
207
-
208
-
209
-
210
-
211
-
212
-
213
-
214
-
215
-
216
-
217
-
218
-
219
-
220
-
221
-
222
-
223
-
224
-
225
-
226
-
227
-
228
-
229
-
230
-
231
-
232
-
233
-
234
-
235
-
236
-
237
-
238
-
239
-
240
-
241
-
242
-
243
-
244
-
245
-
246
-
247
-
248
-
249
-
250
-
251
-
252
-
253
-
254
-
255
-
256
-
257
-
258
-
259
-
260
-
261
-
262
-
263
-
264
-
265
-
266
-
267
-
268
-
269
-
270
-
271
-
272
-
273
-
274
-
275
-
276
-
277
-
278
-
279
-
280
-
281
-
282
-
283
-
284
-
285
-
286
-
287
-
288
-
289
-
290
-
291
-
292
-
293
-
294
-
295
-
296
-
297
-
298
-
299
-
300
-
301
-
302
-
303
-
304
-
305
-
306
-
307
-
308
-
309
-
310
-
311
-
312
-
313
-
314
-
315
-
316
-
317
-
318
-
319
-
320
-
321
-
322
-
323
-
324
-
325
-
326
-
327
-
328
-
329
-
330
-
331
-
332
-
333
-
334
-
335
-
336
-
337
-
338
-
339
-
340
-
341
-
342
-
343
-
344
-
345
-
346
-
347
-
348
-
349
-
350
-
351
-
352
-
353
-
354
-
355
-
356
-
357
-
358
-
359
-
360
-
361
-
362
-
363
-
364
-
365
-
366
-
367
-
368
-
369
-
370
-
371
-
372
-
373
-
374
-
375
-
376
-
377
-
378
-
379
-
380
-
381
-
382
-
383
-
384
-
385
-
386
-
387
-
388
-
389
-
390
-
391
-
392
-
393
-
394
-
395
-
396
-
397
-
398
-
399
-
400
-
401
-
402
-
403
-
404
-
405
-
406
-
407
-
408
-
409
-
410
-
411
-
412
-
413
-
414
-
415
-
416
-
417
-
418
-
419
-
420
-
421
-
422
-
423
-
424
-
425
-
426
-
427
-
428
-
429
-
430
-
431
-
432
-
433
-
434
-
435
-
436
-
437
-
438
-
439
-
440
-
441
-
442
-
443
-
444
-
445
-
446
-
447
-
448
-
449
-
450
-
451
-
452
-
453
-
454
-
455
-
456
-
457
-
458
-
459
-
460
-
461
-
462
-
463
-
464
-
465
-
466
-
467
-
468
-
469
-
470
-
471
-
472
-
473
-
474
-
475
-
476
-
477
-
478
-
479
-
480
-
481
-
482
-
483
-
484
-
485
-
486
-
487
-
488
-
489
-
490
-
491
-
492
-
493
-
494
-
495
-
496
-
497
-
498
-
499
-
500
-
501
-
502
-
503
-
504
-
505
-
506
-
507
-
508
-
509
-
510
-
511
-
512
-
513
-
514
-
515
-
516
-
517
-
518
-
519
-
520
-
521
-
522
-
523
-
524
-
525
-
526
-
527
-
528
-
529
-
530
-
531
-
532
-
533
-
534
-
535
-
536
-
537
-
538
-
539
-
540
-
541
-
542
-
543
-
544
-
545
-
546
-
547
-
548
-
549
-
550
-
551
-
552
-
553
-
554
-
555
-
556
-
557
-
558
-
559
-
560
-
561
-
562
-
563
-
564
 |
 |

Business review
125
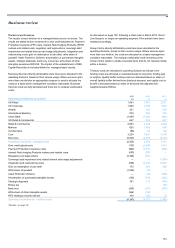
2012 compared with 2011 - managed
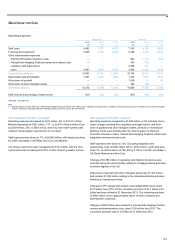
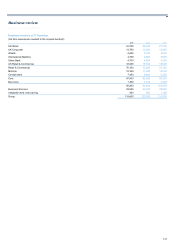
Operating expenses fell by £992 million, or 7%, with staff costs down 9%
(but broadly stable as a percentage of total income) as headcount fell by
8,300 to 119,200. The decline in expenses was largely driven by Non-
Core run-down and lower variable compensation (particularly in Markets),
including bonus award reductions and clawbacks following the
settlements reached with UK and US authorities in relation to attempted
LIBOR manipulation. The run-off of exited businesses in Markets and
International Banking, following the restructuring announced in January
2012, and simplification of processes and headcount reduction in UK
Retail also yielded cost benefits.
Business Services costs were down 6% in the year, reflecting increased
benefits from earlier cost saving programmes as a number of initiatives
reached their full run rate. Technology Services costs were 8% lower and
Corporate Services costs 4% lower. Headcount was 2% down on 2011.
The Core cost:income ratio was broadly flat at 59%, reflecting the
ongoing focus on cost control in an environment where income growth
remained challenging.
2012 compared with 2011 - statutory
Operating expenses increased by £599 million, or 3% primarily due to
charges resulting from legacy conduct issues partially offset by Non-Core
run-down and run-off of exited businesses in Markets and International
Banking, following the restructuring announced in January 2012.
Simplification of processes and headcount reduction in UK Retail also
yielded cost benefits.
Staff expenses were cut by 4%. Excluding integration and restructuring
costs of £811 million (2011 - £464 million), staff costs were down 9%, as
headcount fell by 10,200 to 118,700.
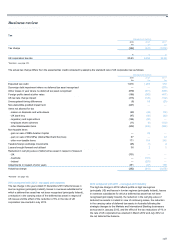
To reflect current experience of Payment Protection Insurance complaints
received, RBS increased its PPI provision by £1,110 million in 2012,
bringing the cumulative charge taken to £2.2 billion, of which £1.3 billion
in redress had been paid by 31 December 2012.
On 31 January 2013, the Financial Services Authority announced the
findings of its industry-wide review of the sale of Interest Rate Hedging
Products to some small and medium-sized businesses that were
classified as retail clients under FSA rules. As a result, RBS provided
£700 million in 2012 to meet the costs of redress.
On 6 February 2013, RBS reached agreement with the Financial
Services Authority, the US Department of Justice and the Commodity
Futures Trading Commission in relation to the setting of LIBOR and other
trading rates, including financial penalties of £381 million. The Group
continues to co-operate with other bodies in this regard and expects it will
incur some additional financial penalties.
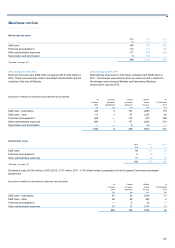
Integration costs
2013 2012 2011
£m £m £m
Staff costs — — 38
Premises and equipment 1 (2) 6
Other administrative expenses 1 2 51
Depreciation and amortisation — — 11
2 — 106
Note:
(1) Integration costs in 2011 excluded a £2 million charge included within net interest income and a loss of £3 million within other operating income in respect of integration activities.
Integration costs of £106 million in 2011 primarily relate to RBS N.V. (formerly ABN AMRO) integration activity during the year, which is now largely
complete.
A
ccruals in relation to integration costs are set out below.
Charge Utilised At
At 1 January to income during 31 December
2013 statement the year 2013
£m £m £m £m
Premises and equipment 9 1 (10) —
Other administrative expenses 5 1 —6
14 2 (10) 6