RBS 2013 Annual Report Download - page 312
Download and view the complete annual report
Please find page 312 of the 2013 RBS annual report below. You can navigate through the pages in the report by either clicking on the pages listed below, or by using the keyword search tool below to find specific information within the annual report.-
 1
1 -
2
-
3
-
4
-
5
-
6
-
7
-
8
-
9
-
10
-
11
-
12
-
13
-
14
-
15
-
16
-
17
-
18
-
19
-
20
-
21
-
22
-
23
-
24
-
25
-
26
-
27
-
28
-
29
-
30
-
31
-
32
-
33
-
34
-
35
-
36
-
37
-
38
-
39
-
40
-
41
-
42
-
43
-
44
-
45
-
46
-
47
-
48
-
49
-
50
-
51
-
52
-
53
-
54
-
55
-
56
-
57
-
58
-
59
-
60
-
61
-
62
-
63
-
64
-
65
-
66
-
67
-
68
-
69
-
70
-
71
-
72
-
73
-
74
-
75
-
76
-
77
-
78
-
79
-
80
-
81
-
82
-
83
-
84
-
85
-
86
-
87
-
88
-
89
-
90
-
91
-
92
-
93
-
94
-
95
-
96
-
97
-
98
-
99
-
100
-
101
-
102
-
103
-
104
-
105
-
106
-
107
-
108
-
109
-
110
-
111
-
112
-
113
-
114
-
115
-
116
-
117
-
118
-
119
-
120
-
121
-
122
-
123
-
124
-
125
-
126
-
127
-
128
-
129
-
130
-
131
-
132
-
133
-
134
-
135
-
136
-
137
-
138
-
139
-
140
-
141
-
142
-
143
-
144
-
145
-
146
-
147
-
148
-
149
-
150
-
151
-
152
-
153
-
154
-
155
-
156
-
157
-
158
-
159
-
160
-
161
-
162
-
163
-
164
-
165
-
166
-
167
-
168
-
169
-
170
-
171
-
172
-
173
-
174
-
175
-
176
-
177
-
178
-
179
-
180
-
181
-
182
-
183
-
184
-
185
-
186
-
187
-
188
-
189
-
190
-
191
-
192
-
193
-
194
-
195
-
196
-
197
-
198
-
199
-
200
-
201
-
202
-
203
-
204
-
205
-
206
-
207
-
208
-
209
-
210
-
211
-
212
-
213
-
214
-
215
-
216
-
217
-
218
-
219
-
220
-
221
-
222
-
223
-
224
-
225
-
226
-
227
-
228
-
229
-
230
-
231
-
232
-
233
-
234
-
235
-
236
-
237
-
238
-
239
-
240
-
241
-
242
-
243
-
244
-
245
-
246
-
247
-
248
-
249
-
250
-
251
-
252
-
253
-
254
-
255
-
256
-
257
-
258
-
259
-
260
-
261
-
262
-
263
-
264
-
265
-
266
-
267
-
268
-
269
-
270
-
271
-
272
-
273
-
274
-
275
-
276
-
277
-
278
-
279
-
280
-
281
-
282
-
283
-
284
-
285
-
286
-
287
-
288
-
289
-
290
-
291
-
292
-
293
-
294
-
295
-
296
-
297
-
298
-
299
-
300
-
301
-
 302
302 -
 303
303 -
 304
304 -
 305
305 -
 306
306 -
 307
307 -
 308
308 -
 309
309 -
 310
310 -
 311
311 -
 312
312 -
 313
313 -
 314
314 -
 315
315 -
 316
316 -
 317
317 -
 318
318 -
 319
319 -
 320
320 -
 321
321 -
 322
322 -
323
-
324
-
325
-
326
-
327
-
328
-
329
-
330
-
331
-
332
-
333
-
334
-
335
-
336
-
337
-
338
-
339
-
340
-
341
-
342
-
343
-
344
-
345
-
346
-
347
-
348
-
349
-
350
-
351
-
352
-
353
-
354
-
355
-
356
-
357
-
358
-
359
-
360
-
361
-
362
-
363
-
364
-
365
-
366
-
367
-
368
-
369
-
370
-
371
-
372
-
373
-
374
-
375
-
376
-
377
-
378
-
379
-
380
-
381
-
382
-
383
-
384
-
385
-
386
-
387
-
388
-
389
-
390
-
391
-
392
-
393
-
394
-
395
-
396
-
397
-
398
-
399
-
400
-
401
-
402
-
403
-
404
-
405
-
406
-
407
-
408
-
409
-
410
-
411
-
412
-
413
-
414
-
415
-
416
-
417
-
418
-
419
-
420
-
421
-
422
-
423
-
424
-
425
-
426
-
427
-
428
-
429
-
430
-
431
-
432
-
433
-
434
-
435
-
436
-
437
-
438
-
439
-
440
-
441
-
442
-
443
-
444
-
445
-
446
-
447
-
448
-
449
-
450
-
451
-
452
-
453
-
454
-
455
-
456
-
457
-
458
-
459
-
460
-
461
-
462
-
463
-
464
-
465
-
466
-
467
-
468
-
469
-
470
-
471
-
472
-
473
-
474
-
475
-
476
-
477
-
478
-
479
-
480
-
481
-
482
-
483
-
484
-
485
-
486
-
487
-
488
-
489
-
490
-
491
-
492
-
493
-
494
-
495
-
496
-
497
-
498
-
499
-
500
-
501
-
502
-
503
-
504
-
505
-
506
-
507
-
508
-
509
-
510
-
511
-
512
-
513
-
514
-
515
-
516
-
517
-
518
-
519
-
520
-
521
-
522
-
523
-
524
-
525
-
526
-
527
-
528
-
529
-
530
-
531
-
532
-
533
-
534
-
535
-
536
-
537
-
538
-
539
-
540
-
541
-
542
-
543
-
544
-
545
-
546
-
547
-
548
-
549
-
550
-
551
-
552
-
553
-
554
-
555
-
556
-
557
-
558
-
559
-
560
-
561
-
562
-
563
-
564
 |
 |

Business review Risk and balance sheet management
310
Balance sheet analysis continued
REIL, provisions and AFS reserves continued
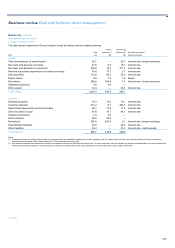
Provisions and AFS reserves methodology
The Group's consumer portfolios, which consist of high volume, small
value credits, have highly efficient largely automated processes for
identifying problem credits and very short timescales, typically three
months, before resolution or adoption of various recovery methods.
Corporate portfolios consist of higher value, lower volume credits, which
tend to be structured to meet individual customer requirements.
Provisions are assessed on a case by case basis by experienced
specialists with input from professional valuers and accountants. The
Group operates a transparent provisions governance framework, setting
thresholds to trigger enhanced oversight and challenge.
Analyses of provisions are set out on pages 312 to 314.
Available-for-sale financial assets are initially recognised at fair value plus
directly related transaction costs and are subsequently measured at fair
value with changes in fair value reported in owners’ equity until disposal,
at which stage the cumulative gain or loss is recognised in profit or loss.
When there is objective evidence that an available-for-sale financial asset
is impaired, any decline in its fair value below original cost is removed
from equity and recognised in profit or loss.
The Group reviews its portfolios of available-for-sale financial assets for
evidence of impairment, which includes: default or delinquency in interest
or principal payments; significant financial difficulty of the issuer or
obligor; and it becoming probable that the issuer will enter bankruptcy or
other financial reorganisation. However, the disappearance of an active
market because an entity’s financial instruments are no longer publicly
traded is not evidence of impairment. Furthermore, a downgrade of an
entity’s credit rating is not, of itself, evidence of impairment, although it
may be evidence of impairment when considered with other available
information. A decline in the fair value of a financial asset below its cost
or amortised cost is not necessarily evidence of impairment. Determining
whether objective evidence of impairment exists requires the exercise of
management judgement. The unrecognised losses on the Group’s
available-for-sale debt securities are concentrated in its portfolios of
mortgage-backed securities. The losses reflect the widening of credit
spreads as a result of the reduced market liquidity in these securities and
the current uncertain macroeconomic outlook in the US and Europe. The
underlying securities remain unimpaired.
Analyses of AFS debt securities and related AFS reserves are set out on
page 316 and 317.
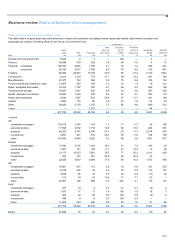
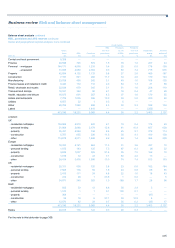
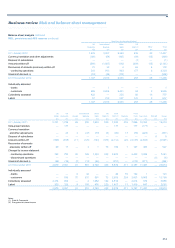
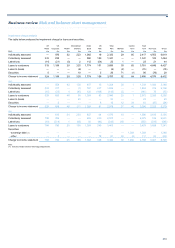
REIL flow statement
REIL are stated without giving effect to any security held that could reduce the eventual loss should it occur or to any provisions marked.
UK UK International Ulster US Retail & Central
Retail Corporate Wealth Banking Bank Commercial Markets items Core Non-Core Total
£m £m £m £m £m £m £m £m £m £m £m
A
t 1 January 2013 4,569 5,452 248 422 7,533 1,146 396 — 19,766 21,374 41,140
Currency translation and other
adjustments — 11 2 (11) 134 (21) 1 — 116 279 395
Disposal of subsidiaries — — — — — — — — — (89) (89)
A
dditions 1,302 4,825 132 431 2,479 282 14 1 9,466 3,397 12,863
Transfers (1) (445) 418 — 133 — — — — 106 (1) 105
Transfers to performing book — (54) (3) (118) — — — — (175) (108) (283)
Repayments (1,045) (3,654) (87) (106) (1,403) (89) (27) — (6,411) (3,982) (10,393)
A
mounts written-off (815) (772) (15) (281) (277) (284) (46) — (2,490) (1,856) (4,346)
A
t 31 December 2013 3,566 6,226 277 470 8,466 1,034 338 1 20,378 19,014 39,392
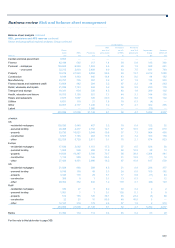
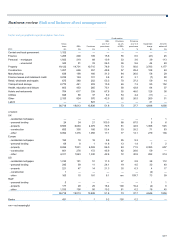
Non-Core (by donating divisions)
UK International Ulster US Retail &
Corporate Banking Bank Commercial Other Total
£m £m £m £m £m £m
A
t 1 January 2013 2,622 6,907 11,399 418 28 21,374
Currency translation and other adjustments 8 67 206 (2) — 279
Disposal of subsidiaries — — (89) — — (89)
A
dditions 1,327 1,283 705 80 2 3,397
Transfers (1) (1) — — — — (1)
Transfers to performing book (4) (101) (2) — (1) (108)
Repayments (1,350) (1,774) (816) (41) (1) (3,982)
A
mounts written-off (379) (875) (431) (165) (6) (1,856)
A
t 31 December 2013 2,223 5,507 10,972 290 22 19,014
Note:
(1) Represents transfers between REIL and potential problem loans.