RBS 2013 Annual Report Download - page 254
Download and view the complete annual report
Please find page 254 of the 2013 RBS annual report below. You can navigate through the pages in the report by either clicking on the pages listed below, or by using the keyword search tool below to find specific information within the annual report.-
 1
1 -
2
-
3
-
4
-
5
-
6
-
7
-
8
-
9
-
10
-
11
-
12
-
13
-
14
-
15
-
16
-
17
-
18
-
19
-
20
-
21
-
22
-
23
-
24
-
25
-
26
-
27
-
28
-
29
-
30
-
31
-
32
-
33
-
34
-
35
-
36
-
37
-
38
-
39
-
40
-
41
-
42
-
43
-
44
-
45
-
46
-
47
-
48
-
49
-
50
-
51
-
52
-
53
-
54
-
55
-
56
-
57
-
58
-
59
-
60
-
61
-
62
-
63
-
64
-
65
-
66
-
67
-
68
-
69
-
70
-
71
-
72
-
73
-
74
-
75
-
76
-
77
-
78
-
79
-
80
-
81
-
82
-
83
-
84
-
85
-
86
-
87
-
88
-
89
-
90
-
91
-
92
-
93
-
94
-
95
-
96
-
97
-
98
-
99
-
100
-
101
-
102
-
103
-
104
-
105
-
106
-
107
-
108
-
109
-
110
-
111
-
112
-
113
-
114
-
115
-
116
-
117
-
118
-
119
-
120
-
121
-
122
-
123
-
124
-
125
-
126
-
127
-
128
-
129
-
130
-
131
-
132
-
133
-
134
-
135
-
136
-
137
-
138
-
139
-
140
-
141
-
142
-
143
-
144
-
145
-
146
-
147
-
148
-
149
-
150
-
151
-
152
-
153
-
154
-
155
-
156
-
157
-
158
-
159
-
160
-
161
-
162
-
163
-
164
-
165
-
166
-
167
-
168
-
169
-
170
-
171
-
172
-
173
-
174
-
175
-
176
-
177
-
178
-
179
-
180
-
181
-
182
-
183
-
184
-
185
-
186
-
187
-
188
-
189
-
190
-
191
-
192
-
193
-
194
-
195
-
196
-
197
-
198
-
199
-
200
-
201
-
202
-
203
-
204
-
205
-
206
-
207
-
208
-
209
-
210
-
211
-
212
-
213
-
214
-
215
-
216
-
217
-
218
-
219
-
220
-
221
-
222
-
223
-
224
-
225
-
226
-
227
-
228
-
229
-
230
-
231
-
232
-
233
-
234
-
235
-
236
-
237
-
238
-
239
-
240
-
241
-
242
-
243
-
 244
244 -
 245
245 -
 246
246 -
 247
247 -
 248
248 -
 249
249 -
 250
250 -
 251
251 -
 252
252 -
 253
253 -
 254
254 -
 255
255 -
 256
256 -
 257
257 -
 258
258 -
 259
259 -
 260
260 -
 261
261 -
 262
262 -
 263
263 -
 264
264 -
265
-
266
-
267
-
268
-
269
-
270
-
271
-
272
-
273
-
274
-
275
-
276
-
277
-
278
-
279
-
280
-
281
-
282
-
283
-
284
-
285
-
286
-
287
-
288
-
289
-
290
-
291
-
292
-
293
-
294
-
295
-
296
-
297
-
298
-
299
-
300
-
301
-
302
-
303
-
304
-
305
-
306
-
307
-
308
-
309
-
310
-
311
-
312
-
313
-
314
-
315
-
316
-
317
-
318
-
319
-
320
-
321
-
322
-
323
-
324
-
325
-
326
-
327
-
328
-
329
-
330
-
331
-
332
-
333
-
334
-
335
-
336
-
337
-
338
-
339
-
340
-
341
-
342
-
343
-
344
-
345
-
346
-
347
-
348
-
349
-
350
-
351
-
352
-
353
-
354
-
355
-
356
-
357
-
358
-
359
-
360
-
361
-
362
-
363
-
364
-
365
-
366
-
367
-
368
-
369
-
370
-
371
-
372
-
373
-
374
-
375
-
376
-
377
-
378
-
379
-
380
-
381
-
382
-
383
-
384
-
385
-
386
-
387
-
388
-
389
-
390
-
391
-
392
-
393
-
394
-
395
-
396
-
397
-
398
-
399
-
400
-
401
-
402
-
403
-
404
-
405
-
406
-
407
-
408
-
409
-
410
-
411
-
412
-
413
-
414
-
415
-
416
-
417
-
418
-
419
-
420
-
421
-
422
-
423
-
424
-
425
-
426
-
427
-
428
-
429
-
430
-
431
-
432
-
433
-
434
-
435
-
436
-
437
-
438
-
439
-
440
-
441
-
442
-
443
-
444
-
445
-
446
-
447
-
448
-
449
-
450
-
451
-
452
-
453
-
454
-
455
-
456
-
457
-
458
-
459
-
460
-
461
-
462
-
463
-
464
-
465
-
466
-
467
-
468
-
469
-
470
-
471
-
472
-
473
-
474
-
475
-
476
-
477
-
478
-
479
-
480
-
481
-
482
-
483
-
484
-
485
-
486
-
487
-
488
-
489
-
490
-
491
-
492
-
493
-
494
-
495
-
496
-
497
-
498
-
499
-
500
-
501
-
502
-
503
-
504
-
505
-
506
-
507
-
508
-
509
-
510
-
511
-
512
-
513
-
514
-
515
-
516
-
517
-
518
-
519
-
520
-
521
-
522
-
523
-
524
-
525
-
526
-
527
-
528
-
529
-
530
-
531
-
532
-
533
-
534
-
535
-
536
-
537
-
538
-
539
-
540
-
541
-
542
-
543
-
544
-
545
-
546
-
547
-
548
-
549
-
550
-
551
-
552
-
553
-
554
-
555
-
556
-
557
-
558
-
559
-
560
-
561
-
562
-
563
-
564
 |
 |

Business review Risk and balance sheet management
252
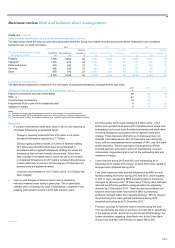
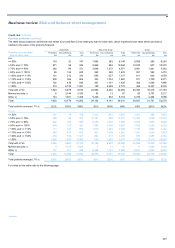
Credit risk continued
Key loan portfolios*
Commercial real estate
The commercial real estate sector comprised exposures to entities involved in the development of, or investment in, commercial and residential
properties (including house builders). The analysis of lending utilisations below is gross of impairment provisions and excludes rate risk management
and contingent obligations.
2013 2012 2011
Investment Development Total Investment Development Total Investment Development Total
Commercial real estate
by division (1) £m £m £m £m £m £m £m £m £m
Core
UK Corporate 20,547 3,467 24,014 22,504 4,091 26,595 25,101 5,023 30,124
Ulster Bank 3,419 718 4,137 3,575 729 4,304 3,882 881 4,763
US Retail & Commercial 4,018 — 4,018 3,857 3 3,860 4,235 70 4,305
International Banking 762 182 944 849 315 1,164 872 299 1,171
Markets 136 1 137 630 57 687 141 61 202
28,882 4,368 33,250 31,415 5,195 36,610 34,231 6,334 40,565
Non-Core
UK Corporate 1,201 774 1,975 2,651 983 3,634 3,957 2,020 5,977
Ulster Bank 3,211 6,915 10,126 3,383 7,607 10,990 3,860 8,490 12,350
US Retail & Commercial 232 — 232 392 — 392 901 28 929
International Banking 6,980 15 6,995 11,260 154 11,414 14,689 336 15,025
11,624 7,704 19,328 17,686 8,744 26,430 23,407 10,874 34,281
40,506 12,072 52,578 49,101 13,939 63,040 57,638 17,208 74,846
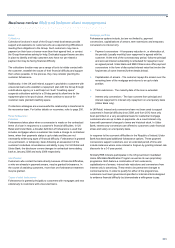
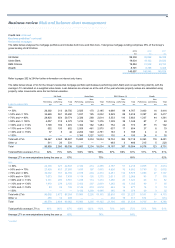
Investment Development Investment Development
Commercial Residential Commercial Residential Total Core Non-Core Core Non-Core Total
Commercial real estate
by geography (1) £m £m £m £m £m £m £m £m £m £m
2013
UK (excluding NI (2)) 20,862 5,007 678 3,733 30,280 21,297 4,572 3,500 911 30,280
Ireland (ROI and NI (2)) 4,405 1,028 1,919 5,532 12,884 2,763 2,670 686 6,765 12,884
Western Europe (other) 4,068 183 22 17 4,290 223 4,028 11 28 4,290
US 3,563 1,076 — 8 4,647 4,313 326 8 — 4,647
RoW (2) 314 — 30 133 477 286 28 163 — 477
33,212 7,294 2,649 9,423 52,578 28,882 11,624 4,368 7,704 52,578
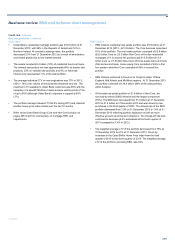
2012
UK (excluding NI (2)) 25,864 5,567 839 4,777 37,047 23,312 8,119 4,184 1,432 37,047
Ireland (ROI and NI (2)) 4,651 989 2,234 5,712 13,586 2,877 2,763 665 7,281 13,586
Western Europe (other) 5,995 370 22 33 6,420 403 5,962 24 31 6,420
US 4,230 981 — 15 5,226 4,629 582 15 — 5,226
RoW (2) 454 — 65 242 761 194 260 307 — 761
41,194 7,907 3,160 10,779 63,040 31,415 17,686 5,195 8,744 63,040
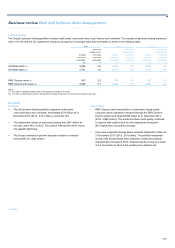
2011
UK (excluding NI (2)) 28,653 6,359 1,198 6,511 42,721 25,904 9,108 5,118 2,591 42,721
Ireland (ROI and NI (2)) 5,146 1,132 2,591 6,317 15,186 3,157 3,121 793 8,115 15,186
Western Europe (other) 7,649 1,048 9 52 8,758 422 8,275 20 41 8,758
US 5,552 1,279 59 46 6,936 4,521 2,310 71 34 6,936
RoW (2) 785 35 141 284 1,245 227 593 332 93 1,245
47,785 9,853 3,998 13,210 74,846 34,231 23,407 6,334 10,874 74,846
For the notes to these tables refer to the following page.
*unaudited