RBS 2013 Annual Report Download - page 261
Download and view the complete annual report
Please find page 261 of the 2013 RBS annual report below. You can navigate through the pages in the report by either clicking on the pages listed below, or by using the keyword search tool below to find specific information within the annual report.-
 1
1 -
2
-
3
-
4
-
5
-
6
-
7
-
8
-
9
-
10
-
11
-
12
-
13
-
14
-
15
-
16
-
17
-
18
-
19
-
20
-
21
-
22
-
23
-
24
-
25
-
26
-
27
-
28
-
29
-
30
-
31
-
32
-
33
-
34
-
35
-
36
-
37
-
38
-
39
-
40
-
41
-
42
-
43
-
44
-
45
-
46
-
47
-
48
-
49
-
50
-
51
-
52
-
53
-
54
-
55
-
56
-
57
-
58
-
59
-
60
-
61
-
62
-
63
-
64
-
65
-
66
-
67
-
68
-
69
-
70
-
71
-
72
-
73
-
74
-
75
-
76
-
77
-
78
-
79
-
80
-
81
-
82
-
83
-
84
-
85
-
86
-
87
-
88
-
89
-
90
-
91
-
92
-
93
-
94
-
95
-
96
-
97
-
98
-
99
-
100
-
101
-
102
-
103
-
104
-
105
-
106
-
107
-
108
-
109
-
110
-
111
-
112
-
113
-
114
-
115
-
116
-
117
-
118
-
119
-
120
-
121
-
122
-
123
-
124
-
125
-
126
-
127
-
128
-
129
-
130
-
131
-
132
-
133
-
134
-
135
-
136
-
137
-
138
-
139
-
140
-
141
-
142
-
143
-
144
-
145
-
146
-
147
-
148
-
149
-
150
-
151
-
152
-
153
-
154
-
155
-
156
-
157
-
158
-
159
-
160
-
161
-
162
-
163
-
164
-
165
-
166
-
167
-
168
-
169
-
170
-
171
-
172
-
173
-
174
-
175
-
176
-
177
-
178
-
179
-
180
-
181
-
182
-
183
-
184
-
185
-
186
-
187
-
188
-
189
-
190
-
191
-
192
-
193
-
194
-
195
-
196
-
197
-
198
-
199
-
200
-
201
-
202
-
203
-
204
-
205
-
206
-
207
-
208
-
209
-
210
-
211
-
212
-
213
-
214
-
215
-
216
-
217
-
218
-
219
-
220
-
221
-
222
-
223
-
224
-
225
-
226
-
227
-
228
-
229
-
230
-
231
-
232
-
233
-
234
-
235
-
236
-
237
-
238
-
239
-
240
-
241
-
242
-
243
-
244
-
245
-
246
-
247
-
248
-
249
-
250
-
 251
251 -
 252
252 -
 253
253 -
 254
254 -
 255
255 -
 256
256 -
 257
257 -
 258
258 -
 259
259 -
 260
260 -
 261
261 -
 262
262 -
 263
263 -
 264
264 -
 265
265 -
 266
266 -
 267
267 -
 268
268 -
 269
269 -
 270
270 -
 271
271 -
272
-
273
-
274
-
275
-
276
-
277
-
278
-
279
-
280
-
281
-
282
-
283
-
284
-
285
-
286
-
287
-
288
-
289
-
290
-
291
-
292
-
293
-
294
-
295
-
296
-
297
-
298
-
299
-
300
-
301
-
302
-
303
-
304
-
305
-
306
-
307
-
308
-
309
-
310
-
311
-
312
-
313
-
314
-
315
-
316
-
317
-
318
-
319
-
320
-
321
-
322
-
323
-
324
-
325
-
326
-
327
-
328
-
329
-
330
-
331
-
332
-
333
-
334
-
335
-
336
-
337
-
338
-
339
-
340
-
341
-
342
-
343
-
344
-
345
-
346
-
347
-
348
-
349
-
350
-
351
-
352
-
353
-
354
-
355
-
356
-
357
-
358
-
359
-
360
-
361
-
362
-
363
-
364
-
365
-
366
-
367
-
368
-
369
-
370
-
371
-
372
-
373
-
374
-
375
-
376
-
377
-
378
-
379
-
380
-
381
-
382
-
383
-
384
-
385
-
386
-
387
-
388
-
389
-
390
-
391
-
392
-
393
-
394
-
395
-
396
-
397
-
398
-
399
-
400
-
401
-
402
-
403
-
404
-
405
-
406
-
407
-
408
-
409
-
410
-
411
-
412
-
413
-
414
-
415
-
416
-
417
-
418
-
419
-
420
-
421
-
422
-
423
-
424
-
425
-
426
-
427
-
428
-
429
-
430
-
431
-
432
-
433
-
434
-
435
-
436
-
437
-
438
-
439
-
440
-
441
-
442
-
443
-
444
-
445
-
446
-
447
-
448
-
449
-
450
-
451
-
452
-
453
-
454
-
455
-
456
-
457
-
458
-
459
-
460
-
461
-
462
-
463
-
464
-
465
-
466
-
467
-
468
-
469
-
470
-
471
-
472
-
473
-
474
-
475
-
476
-
477
-
478
-
479
-
480
-
481
-
482
-
483
-
484
-
485
-
486
-
487
-
488
-
489
-
490
-
491
-
492
-
493
-
494
-
495
-
496
-
497
-
498
-
499
-
500
-
501
-
502
-
503
-
504
-
505
-
506
-
507
-
508
-
509
-
510
-
511
-
512
-
513
-
514
-
515
-
516
-
517
-
518
-
519
-
520
-
521
-
522
-
523
-
524
-
525
-
526
-
527
-
528
-
529
-
530
-
531
-
532
-
533
-
534
-
535
-
536
-
537
-
538
-
539
-
540
-
541
-
542
-
543
-
544
-
545
-
546
-
547
-
548
-
549
-
550
-
551
-
552
-
553
-
554
-
555
-
556
-
557
-
558
-
559
-
560
-
561
-
562
-
563
-
564
 |
 |

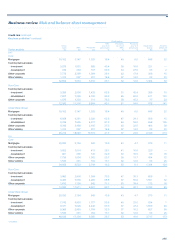
Business review Risk and balance sheet management
259
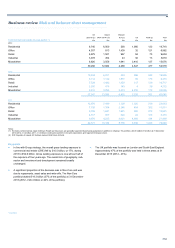
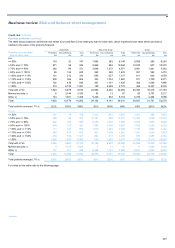
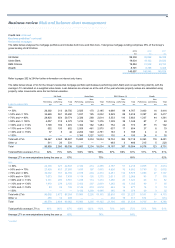
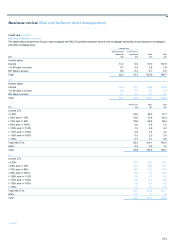
UK Retail Ulster Bank RBS Citizens (1)
Non- Non- Non-
Performing performing Total Performing performing Total Performing performing Total
Loan-to-value ratio £m £m £m £m £m £m £m £m £m
2011
<= 50% 21,537 285 21,822 2,568 222 2,790 4,745 49 4,794
> 50% and <= 70% 25,598 390 25,988 1,877 157 2,034 4,713 78 4,791
> 70% and <= 90% 33,738 671 34,409 2,280 223 2,503 6,893 125 7,018
> 90% and <= 100% 7,365 343 7,708 1,377 128 1,505 2,352 66 2,418
> 100% and <= 110% 3,817 276 4,093 1,462 130 1,592 1,517 53 1,570
> 110% and <= 130% 1,514 199 1,713 2,752 322 3,074 1,536 53 1,589
> 130% and <= 150% 60 15 75 2,607 369 2,976 626 28 654
> 150% — — — 2,798 748 3,546 588 27 615
Total with LTVs 93,629 2,179 95,808 17,721 2,299 20,020 22,970 479 23,449
Other (2) 567 13 580 — — — 681 23 704
Total 94,196 2,192 96,388 17,721 2,299 20,020 23,651 502 24,153
Total portfolio average LTV (3) 67% 80% 67% 104% 125% 106% 76% 91% 77%
A
verage LTV on new originations during the year (3) 63% 74% 63%
Notes:
(1) Includes residential mortgages and home equity loans and lines (refer to page 260 for a breakdown of balances).
(2) Where no indexed LTV is held.
(3) Average LTV weighted by value is calculated using the LTV on each individual mortgage and applying a weighting based on the value of each mortgage.
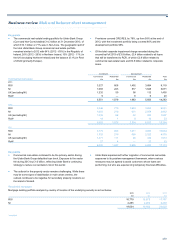
Key points
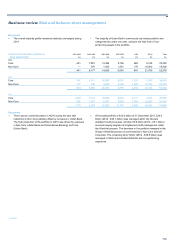
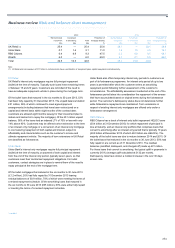
UK Retail
• The UK Retail mortgage portfolio was £99.3 billion at 31 December
2013, an increase of 0.3% from 31 December 2012. The mortgages
included £9.1 billion (2012 - £7.9 billion) of residential buy-to-let
lending.
• As at 31 December 2013, approximately 43% of the portfolio
consisted of fixed rate, 5% a combination of fixed and variable rates
and the remainder were variable rate mortgages (including those on
managed rates). The interest only proportion of the total portfolio
was 26%.
• Gross new mortgage lending amounted to £14.4 billion and the
average LTV by volume was 62.7% compared to 61.3% at
31 December 2012. The average LTV calculated by weighted LTV
of lending was 66.6% (2012 - 65.2%).
• Based on the Halifax Price Index at September 2013, the portfolio-
average indexed LTV by volume was 54.1% (2012 - 58.1%) and
62.0% by weighted value of debt outstanding (2012 - 66.8%). The
ratio of total outstanding balances to total indexed property
valuations was 45.1% (2012 - 48.5%).
*unaudited
• All new mortgage business is subject to a comprehensive
assessment. This includes: i) an affordability test which includes a
stressed interest rate that is higher than the customer pay rate; ii)
credit scoring; iii) a maximum loan-to-value of 90% with the
exception of the UK Government backed schemes Help-to-Buy
(from the fourth quarter of 2013), New Buy and My New Home
products where lending of up to 95% is provided; and iv) a range of
policy rules that restrict the availability of credit to borrowers with
higher risk characteristics, for example highly indebted and/or
adverse payment behaviour on previous borrowings.
• The arrears rate (defined as more than three payments in arrears,
excluding repossessions and shortfalls post property sale), fell to
1.3% (2012 - 1.5%). The number of properties repossessed in 2013
was 1,532 compared with 1,426 in 2012. Arrears rates remained
sensitive to economic developments and benefited from the low
interest rate environment.
• The impairment charge for mortgage loans was £30 million for 2013
compared to £92 million in 2012, reflecting a lower level of defaults
and reduced loss rates as valuations improved on properties held as
security on defaulted debt.