RBS 2013 Annual Report Download - page 486
Download and view the complete annual report
Please find page 486 of the 2013 RBS annual report below. You can navigate through the pages in the report by either clicking on the pages listed below, or by using the keyword search tool below to find specific information within the annual report.-
 1
1 -
2
-
3
-
4
-
5
-
6
-
7
-
8
-
9
-
10
-
11
-
12
-
13
-
14
-
15
-
16
-
17
-
18
-
19
-
20
-
21
-
22
-
23
-
24
-
25
-
26
-
27
-
28
-
29
-
30
-
31
-
32
-
33
-
34
-
35
-
36
-
37
-
38
-
39
-
40
-
41
-
42
-
43
-
44
-
45
-
46
-
47
-
48
-
49
-
50
-
51
-
52
-
53
-
54
-
55
-
56
-
57
-
58
-
59
-
60
-
61
-
62
-
63
-
64
-
65
-
66
-
67
-
68
-
69
-
70
-
71
-
72
-
73
-
74
-
75
-
76
-
77
-
78
-
79
-
80
-
81
-
82
-
83
-
84
-
85
-
86
-
87
-
88
-
89
-
90
-
91
-
92
-
93
-
94
-
95
-
96
-
97
-
98
-
99
-
100
-
101
-
102
-
103
-
104
-
105
-
106
-
107
-
108
-
109
-
110
-
111
-
112
-
113
-
114
-
115
-
116
-
117
-
118
-
119
-
120
-
121
-
122
-
123
-
124
-
125
-
126
-
127
-
128
-
129
-
130
-
131
-
132
-
133
-
134
-
135
-
136
-
137
-
138
-
139
-
140
-
141
-
142
-
143
-
144
-
145
-
146
-
147
-
148
-
149
-
150
-
151
-
152
-
153
-
154
-
155
-
156
-
157
-
158
-
159
-
160
-
161
-
162
-
163
-
164
-
165
-
166
-
167
-
168
-
169
-
170
-
171
-
172
-
173
-
174
-
175
-
176
-
177
-
178
-
179
-
180
-
181
-
182
-
183
-
184
-
185
-
186
-
187
-
188
-
189
-
190
-
191
-
192
-
193
-
194
-
195
-
196
-
197
-
198
-
199
-
200
-
201
-
202
-
203
-
204
-
205
-
206
-
207
-
208
-
209
-
210
-
211
-
212
-
213
-
214
-
215
-
216
-
217
-
218
-
219
-
220
-
221
-
222
-
223
-
224
-
225
-
226
-
227
-
228
-
229
-
230
-
231
-
232
-
233
-
234
-
235
-
236
-
237
-
238
-
239
-
240
-
241
-
242
-
243
-
244
-
245
-
246
-
247
-
248
-
249
-
250
-
251
-
252
-
253
-
254
-
255
-
256
-
257
-
258
-
259
-
260
-
261
-
262
-
263
-
264
-
265
-
266
-
267
-
268
-
269
-
270
-
271
-
272
-
273
-
274
-
275
-
276
-
277
-
278
-
279
-
280
-
281
-
282
-
283
-
284
-
285
-
286
-
287
-
288
-
289
-
290
-
291
-
292
-
293
-
294
-
295
-
296
-
297
-
298
-
299
-
300
-
301
-
302
-
303
-
304
-
305
-
306
-
307
-
308
-
309
-
310
-
311
-
312
-
313
-
314
-
315
-
316
-
317
-
318
-
319
-
320
-
321
-
322
-
323
-
324
-
325
-
326
-
327
-
328
-
329
-
330
-
331
-
332
-
333
-
334
-
335
-
336
-
337
-
338
-
339
-
340
-
341
-
342
-
343
-
344
-
345
-
346
-
347
-
348
-
349
-
350
-
351
-
352
-
353
-
354
-
355
-
356
-
357
-
358
-
359
-
360
-
361
-
362
-
363
-
364
-
365
-
366
-
367
-
368
-
369
-
370
-
371
-
372
-
373
-
374
-
375
-
376
-
377
-
378
-
379
-
380
-
381
-
382
-
383
-
384
-
385
-
386
-
387
-
388
-
389
-
390
-
391
-
392
-
393
-
394
-
395
-
396
-
397
-
398
-
399
-
400
-
401
-
402
-
403
-
404
-
405
-
406
-
407
-
408
-
409
-
410
-
411
-
412
-
413
-
414
-
415
-
416
-
417
-
418
-
419
-
420
-
421
-
422
-
423
-
424
-
425
-
426
-
427
-
428
-
429
-
430
-
431
-
432
-
433
-
434
-
435
-
436
-
437
-
438
-
439
-
440
-
441
-
442
-
443
-
444
-
445
-
446
-
447
-
448
-
449
-
450
-
451
-
452
-
453
-
454
-
455
-
456
-
457
-
458
-
459
-
460
-
461
-
462
-
463
-
464
-
465
-
466
-
467
-
468
-
469
-
470
-
471
-
472
-
473
-
474
-
475
-
 476
476 -
 477
477 -
 478
478 -
 479
479 -
 480
480 -
 481
481 -
 482
482 -
 483
483 -
 484
484 -
 485
485 -
 486
486 -
 487
487 -
 488
488 -
 489
489 -
 490
490 -
 491
491 -
 492
492 -
 493
493 -
 494
494 -
 495
495 -
 496
496 -
497
-
498
-
499
-
500
-
501
-
502
-
503
-
504
-
505
-
506
-
507
-
508
-
509
-
510
-
511
-
512
-
513
-
514
-
515
-
516
-
517
-
518
-
519
-
520
-
521
-
522
-
523
-
524
-
525
-
526
-
527
-
528
-
529
-
530
-
531
-
532
-
533
-
534
-
535
-
536
-
537
-
538
-
539
-
540
-
541
-
542
-
543
-
544
-
545
-
546
-
547
-
548
-
549
-
550
-
551
-
552
-
553
-
554
-
555
-
556
-
557
-
558
-
559
-
560
-
561
-
562
-
563
-
564
 |
 |

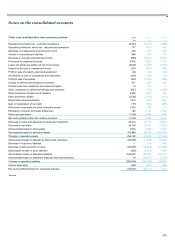
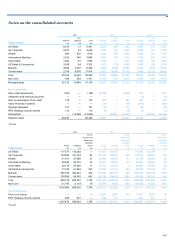
Notes on the consolidated accounts
484
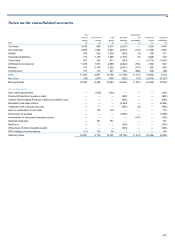
34 Analysis of the net investment in business interests and intangible assets
2013 2012 2011
Acquisitions and disposals £m £m £m
Fair value given for businesses acquired — (68) (44)
Net assets sold 1,435 1,317 (299)
Non-cash consideration 3 (90) —
Profit/(loss) on disposal 240 95 (28)
Net cash and cash equivalents disposed 210 — —
Net inflow/(outflow) of cash in respect of disposals 1,888 1,322 (327)
Dividends received from associates 134 22 11
Cash expenditure on intangible assets (872) (924) (1,068)
Net inflow/(outflow) 1,150 352 (1,428)
Note:
(1) Includes cash proceeds of £578 million in 2013 relating to the disposal of the controlling interest in Direct Line Group.
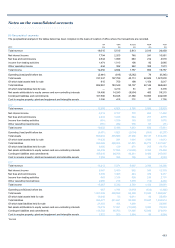
35 Interest received and paid
2013 2012 2011
£m £m £m
Interest received 17,948 19,238 21,777
Interest paid (6,450) (7,044) (8,629)
11,498 12,194 13,148
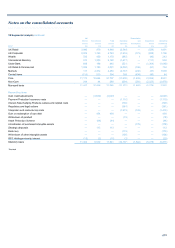
36 Analysis of changes in financing during the year
Share capital, share premium,
paid-in equity and merger reserve Subordinated liabilities
2013 2012* 2011* 2013 2012 2011
£m £m £m £m £m £m
A
t 1 January 45,144 53,520 53,298 26,773 26,319 27,053
Issue of ordinary shares 264 120 2 — — —
Net proceeds from issue of subordinated liabilities — — — 1,796 2,093 —
Repayment of subordinated liabilities — — — (3,500) (258) (627)
Net cash inflow/(outflow) from financing 264 120 2 (1,704) 1,835 (627)
Transfer to retained earnings — — (50) — — —
Share capital sub-division and consolidation — (8,933) — — — —
Ordinary shares issued in respect of employee share schemes 174 437 270 — — —
Other adjustments including foreign exchange — — — (1,057) (1,381) (107)
A
t 31 Decembe
r
45,582 45,144 53,520 24,012 26,773 26,319
*Restated