RBS 2013 Annual Report Download - page 326
Download and view the complete annual report
Please find page 326 of the 2013 RBS annual report below. You can navigate through the pages in the report by either clicking on the pages listed below, or by using the keyword search tool below to find specific information within the annual report.-
 1
1 -
2
-
3
-
4
-
5
-
6
-
7
-
8
-
9
-
10
-
11
-
12
-
13
-
14
-
15
-
16
-
17
-
18
-
19
-
20
-
21
-
22
-
23
-
24
-
25
-
26
-
27
-
28
-
29
-
30
-
31
-
32
-
33
-
34
-
35
-
36
-
37
-
38
-
39
-
40
-
41
-
42
-
43
-
44
-
45
-
46
-
47
-
48
-
49
-
50
-
51
-
52
-
53
-
54
-
55
-
56
-
57
-
58
-
59
-
60
-
61
-
62
-
63
-
64
-
65
-
66
-
67
-
68
-
69
-
70
-
71
-
72
-
73
-
74
-
75
-
76
-
77
-
78
-
79
-
80
-
81
-
82
-
83
-
84
-
85
-
86
-
87
-
88
-
89
-
90
-
91
-
92
-
93
-
94
-
95
-
96
-
97
-
98
-
99
-
100
-
101
-
102
-
103
-
104
-
105
-
106
-
107
-
108
-
109
-
110
-
111
-
112
-
113
-
114
-
115
-
116
-
117
-
118
-
119
-
120
-
121
-
122
-
123
-
124
-
125
-
126
-
127
-
128
-
129
-
130
-
131
-
132
-
133
-
134
-
135
-
136
-
137
-
138
-
139
-
140
-
141
-
142
-
143
-
144
-
145
-
146
-
147
-
148
-
149
-
150
-
151
-
152
-
153
-
154
-
155
-
156
-
157
-
158
-
159
-
160
-
161
-
162
-
163
-
164
-
165
-
166
-
167
-
168
-
169
-
170
-
171
-
172
-
173
-
174
-
175
-
176
-
177
-
178
-
179
-
180
-
181
-
182
-
183
-
184
-
185
-
186
-
187
-
188
-
189
-
190
-
191
-
192
-
193
-
194
-
195
-
196
-
197
-
198
-
199
-
200
-
201
-
202
-
203
-
204
-
205
-
206
-
207
-
208
-
209
-
210
-
211
-
212
-
213
-
214
-
215
-
216
-
217
-
218
-
219
-
220
-
221
-
222
-
223
-
224
-
225
-
226
-
227
-
228
-
229
-
230
-
231
-
232
-
233
-
234
-
235
-
236
-
237
-
238
-
239
-
240
-
241
-
242
-
243
-
244
-
245
-
246
-
247
-
248
-
249
-
250
-
251
-
252
-
253
-
254
-
255
-
256
-
257
-
258
-
259
-
260
-
261
-
262
-
263
-
264
-
265
-
266
-
267
-
268
-
269
-
270
-
271
-
272
-
273
-
274
-
275
-
276
-
277
-
278
-
279
-
280
-
281
-
282
-
283
-
284
-
285
-
286
-
287
-
288
-
289
-
290
-
291
-
292
-
293
-
294
-
295
-
296
-
297
-
298
-
299
-
300
-
301
-
302
-
303
-
304
-
305
-
306
-
307
-
308
-
309
-
310
-
311
-
312
-
313
-
314
-
315
-
 316
316 -
 317
317 -
 318
318 -
 319
319 -
 320
320 -
 321
321 -
 322
322 -
 323
323 -
 324
324 -
 325
325 -
 326
326 -
 327
327 -
 328
328 -
 329
329 -
 330
330 -
 331
331 -
 332
332 -
 333
333 -
 334
334 -
 335
335 -
 336
336 -
337
-
338
-
339
-
340
-
341
-
342
-
343
-
344
-
345
-
346
-
347
-
348
-
349
-
350
-
351
-
352
-
353
-
354
-
355
-
356
-
357
-
358
-
359
-
360
-
361
-
362
-
363
-
364
-
365
-
366
-
367
-
368
-
369
-
370
-
371
-
372
-
373
-
374
-
375
-
376
-
377
-
378
-
379
-
380
-
381
-
382
-
383
-
384
-
385
-
386
-
387
-
388
-
389
-
390
-
391
-
392
-
393
-
394
-
395
-
396
-
397
-
398
-
399
-
400
-
401
-
402
-
403
-
404
-
405
-
406
-
407
-
408
-
409
-
410
-
411
-
412
-
413
-
414
-
415
-
416
-
417
-
418
-
419
-
420
-
421
-
422
-
423
-
424
-
425
-
426
-
427
-
428
-
429
-
430
-
431
-
432
-
433
-
434
-
435
-
436
-
437
-
438
-
439
-
440
-
441
-
442
-
443
-
444
-
445
-
446
-
447
-
448
-
449
-
450
-
451
-
452
-
453
-
454
-
455
-
456
-
457
-
458
-
459
-
460
-
461
-
462
-
463
-
464
-
465
-
466
-
467
-
468
-
469
-
470
-
471
-
472
-
473
-
474
-
475
-
476
-
477
-
478
-
479
-
480
-
481
-
482
-
483
-
484
-
485
-
486
-
487
-
488
-
489
-
490
-
491
-
492
-
493
-
494
-
495
-
496
-
497
-
498
-
499
-
500
-
501
-
502
-
503
-
504
-
505
-
506
-
507
-
508
-
509
-
510
-
511
-
512
-
513
-
514
-
515
-
516
-
517
-
518
-
519
-
520
-
521
-
522
-
523
-
524
-
525
-
526
-
527
-
528
-
529
-
530
-
531
-
532
-
533
-
534
-
535
-
536
-
537
-
538
-
539
-
540
-
541
-
542
-
543
-
544
-
545
-
546
-
547
-
548
-
549
-
550
-
551
-
552
-
553
-
554
-
555
-
556
-
557
-
558
-
559
-
560
-
561
-
562
-
563
-
564
 |
 |
Business review Risk and balance sheet management
324
Market risk continued
Traded market risk continued
VaR limitations*
Historical VaR and the Group’s implementation of this risk measurement
methodology have a number of known limitations, as summarised below,
and the Group’s VaR should be interpreted in light of these. The Group’s
approach is to supplement VaR with other risk metrics that address these
limitations to ensure appropriate coverage of all material market risks.
• Historical simulation VaR may not provide the best estimate of future
market movements. It can only provide a forecast of portfolio losses
based on events that occurred in the past. The Group model uses
the previous two years of data; this period represents a balance
between model responsiveness to recent shocks and risk factor data
coverage.
• The use of a 99% confidence level VaR statistic does not provide
information about losses beyond this level, usually referred to as
‘tail’ risks. These risks are more appropriately assessed using
measures such as Stressed VaR and stress testing.
• The use of a one-day time horizon will not fully capture the profit and
loss implications of positions that cannot be liquidated or hedged
within one day. This may not fully reflect market risk at times of
severe illiquidity in the market when a one-day period may be
insufficient to liquidate or hedge positions fully. Thus, the regulatory
VaR that is used for modelled market risk capital uses a ten-day
time horizon.
• When the Group uses ten-day risk factor changes in the calculation
of the regulatory VaR, the ten-day periods overlap, which can
introduce an autocorrelation bias in the 99% confidence level VaR
statistic. The analysis performed has shown the bias to be small and
acceptable for a ten-day period.
• The Group computes the VaR of trading positions at the close of
business. Positions may change substantially during the course of
the trading day and so intra-day price volatility and trading may not
be captured by the model.
• The data used in the model are collected from global sources. For
some sources, local end-of-day, rather than London end-of-day,
data may be used. This timing mismatch is more material for 1-day
return periods than for 10-day periods (which are used for
capitalisation purposes) as the overlaps are inherently smaller
across shorter periods. When deciding whether or not to use local
end-of-day timing, the internal model review committee balances the
principle of aligning the treatment of positions and their associated
hedges against the goal of using London end-of-day timing
consistently.
• Risk factors relevant to a specific portfolio may be omitted, due to a
lack of reliable data, or the use of proxy risk factors, for example.
The Group has developed the RNIV framework to address these
issues.
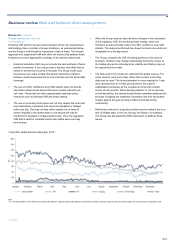
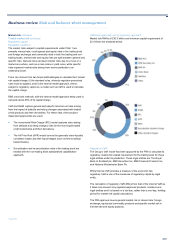
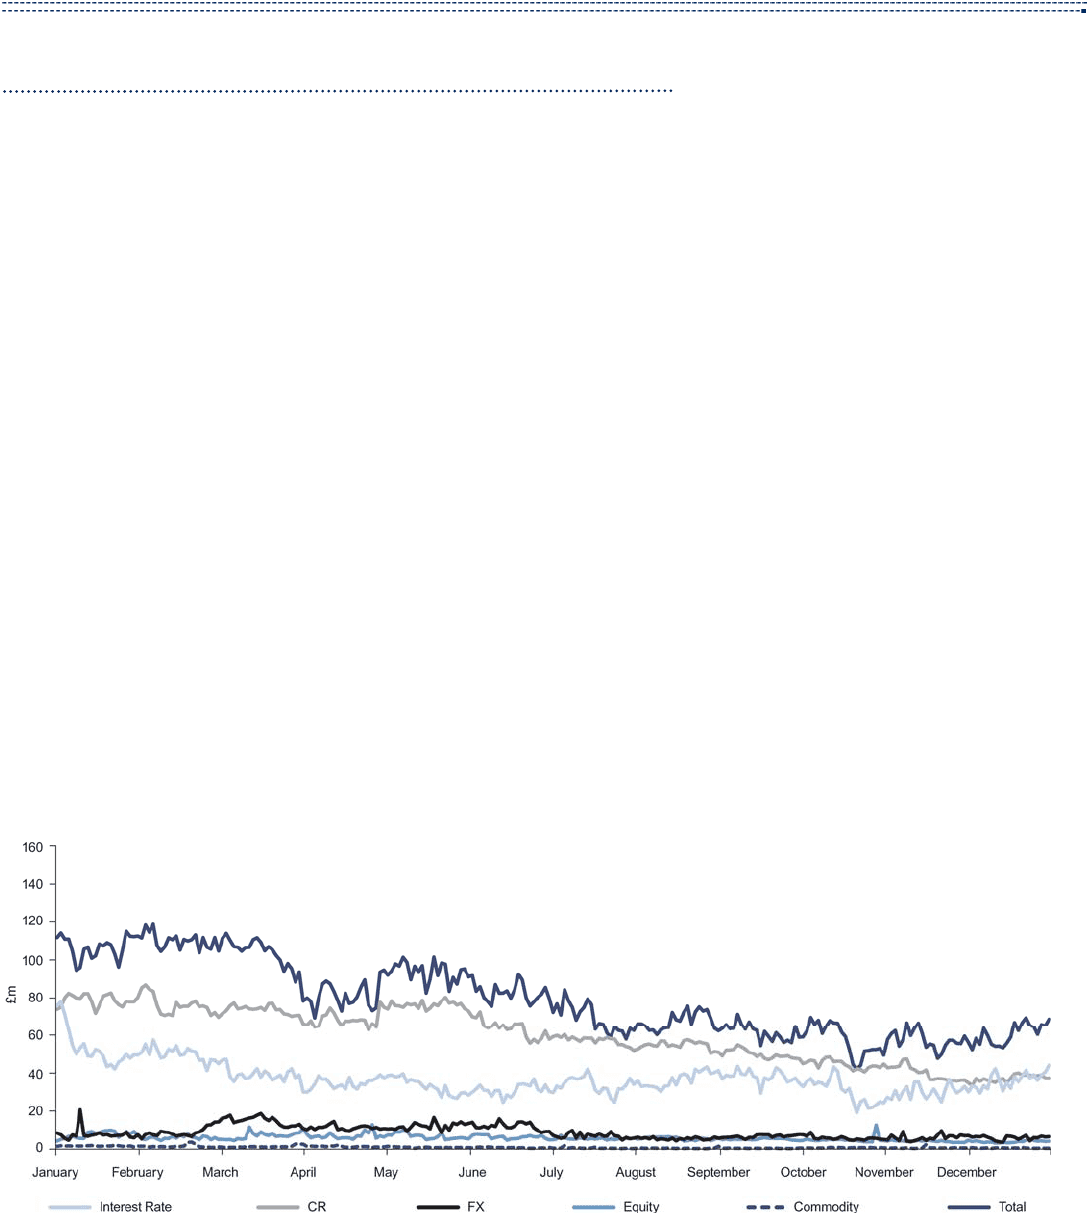
1-Day 99% traded internal VaR graph, 2013.*
Note:
(1) The internal 99% 1-day VaR does not distinguish between regulator approved products and therefore includes a broader range of products. Refer to page 330 for discussion of regulatory VaR.
*unaudited