RBS 2013 Annual Report Download - page 286
Download and view the complete annual report
Please find page 286 of the 2013 RBS annual report below. You can navigate through the pages in the report by either clicking on the pages listed below, or by using the keyword search tool below to find specific information within the annual report.-
 1
1 -
2
-
3
-
4
-
5
-
6
-
7
-
8
-
9
-
10
-
11
-
12
-
13
-
14
-
15
-
16
-
17
-
18
-
19
-
20
-
21
-
22
-
23
-
24
-
25
-
26
-
27
-
28
-
29
-
30
-
31
-
32
-
33
-
34
-
35
-
36
-
37
-
38
-
39
-
40
-
41
-
42
-
43
-
44
-
45
-
46
-
47
-
48
-
49
-
50
-
51
-
52
-
53
-
54
-
55
-
56
-
57
-
58
-
59
-
60
-
61
-
62
-
63
-
64
-
65
-
66
-
67
-
68
-
69
-
70
-
71
-
72
-
73
-
74
-
75
-
76
-
77
-
78
-
79
-
80
-
81
-
82
-
83
-
84
-
85
-
86
-
87
-
88
-
89
-
90
-
91
-
92
-
93
-
94
-
95
-
96
-
97
-
98
-
99
-
100
-
101
-
102
-
103
-
104
-
105
-
106
-
107
-
108
-
109
-
110
-
111
-
112
-
113
-
114
-
115
-
116
-
117
-
118
-
119
-
120
-
121
-
122
-
123
-
124
-
125
-
126
-
127
-
128
-
129
-
130
-
131
-
132
-
133
-
134
-
135
-
136
-
137
-
138
-
139
-
140
-
141
-
142
-
143
-
144
-
145
-
146
-
147
-
148
-
149
-
150
-
151
-
152
-
153
-
154
-
155
-
156
-
157
-
158
-
159
-
160
-
161
-
162
-
163
-
164
-
165
-
166
-
167
-
168
-
169
-
170
-
171
-
172
-
173
-
174
-
175
-
176
-
177
-
178
-
179
-
180
-
181
-
182
-
183
-
184
-
185
-
186
-
187
-
188
-
189
-
190
-
191
-
192
-
193
-
194
-
195
-
196
-
197
-
198
-
199
-
200
-
201
-
202
-
203
-
204
-
205
-
206
-
207
-
208
-
209
-
210
-
211
-
212
-
213
-
214
-
215
-
216
-
217
-
218
-
219
-
220
-
221
-
222
-
223
-
224
-
225
-
226
-
227
-
228
-
229
-
230
-
231
-
232
-
233
-
234
-
235
-
236
-
237
-
238
-
239
-
240
-
241
-
242
-
243
-
244
-
245
-
246
-
247
-
248
-
249
-
250
-
251
-
252
-
253
-
254
-
255
-
256
-
257
-
258
-
259
-
260
-
261
-
262
-
263
-
264
-
265
-
266
-
267
-
268
-
269
-
270
-
271
-
272
-
273
-
274
-
275
-
 276
276 -
 277
277 -
 278
278 -
 279
279 -
 280
280 -
 281
281 -
 282
282 -
 283
283 -
 284
284 -
 285
285 -
 286
286 -
 287
287 -
 288
288 -
 289
289 -
 290
290 -
 291
291 -
 292
292 -
 293
293 -
 294
294 -
 295
295 -
 296
296 -
297
-
298
-
299
-
300
-
301
-
302
-
303
-
304
-
305
-
306
-
307
-
308
-
309
-
310
-
311
-
312
-
313
-
314
-
315
-
316
-
317
-
318
-
319
-
320
-
321
-
322
-
323
-
324
-
325
-
326
-
327
-
328
-
329
-
330
-
331
-
332
-
333
-
334
-
335
-
336
-
337
-
338
-
339
-
340
-
341
-
342
-
343
-
344
-
345
-
346
-
347
-
348
-
349
-
350
-
351
-
352
-
353
-
354
-
355
-
356
-
357
-
358
-
359
-
360
-
361
-
362
-
363
-
364
-
365
-
366
-
367
-
368
-
369
-
370
-
371
-
372
-
373
-
374
-
375
-
376
-
377
-
378
-
379
-
380
-
381
-
382
-
383
-
384
-
385
-
386
-
387
-
388
-
389
-
390
-
391
-
392
-
393
-
394
-
395
-
396
-
397
-
398
-
399
-
400
-
401
-
402
-
403
-
404
-
405
-
406
-
407
-
408
-
409
-
410
-
411
-
412
-
413
-
414
-
415
-
416
-
417
-
418
-
419
-
420
-
421
-
422
-
423
-
424
-
425
-
426
-
427
-
428
-
429
-
430
-
431
-
432
-
433
-
434
-
435
-
436
-
437
-
438
-
439
-
440
-
441
-
442
-
443
-
444
-
445
-
446
-
447
-
448
-
449
-
450
-
451
-
452
-
453
-
454
-
455
-
456
-
457
-
458
-
459
-
460
-
461
-
462
-
463
-
464
-
465
-
466
-
467
-
468
-
469
-
470
-
471
-
472
-
473
-
474
-
475
-
476
-
477
-
478
-
479
-
480
-
481
-
482
-
483
-
484
-
485
-
486
-
487
-
488
-
489
-
490
-
491
-
492
-
493
-
494
-
495
-
496
-
497
-
498
-
499
-
500
-
501
-
502
-
503
-
504
-
505
-
506
-
507
-
508
-
509
-
510
-
511
-
512
-
513
-
514
-
515
-
516
-
517
-
518
-
519
-
520
-
521
-
522
-
523
-
524
-
525
-
526
-
527
-
528
-
529
-
530
-
531
-
532
-
533
-
534
-
535
-
536
-
537
-
538
-
539
-
540
-
541
-
542
-
543
-
544
-
545
-
546
-
547
-
548
-
549
-
550
-
551
-
552
-
553
-
554
-
555
-
556
-
557
-
558
-
559
-
560
-
561
-
562
-
563
-
564
 |
 |

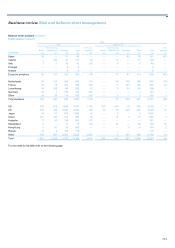
Business review Risk and balance sheet management
284
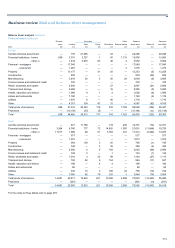
Balance sheet analysis continued
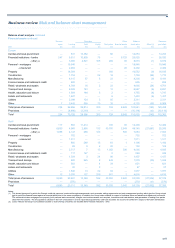
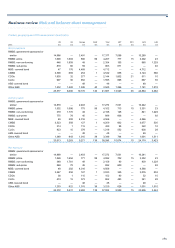
Debt securities
IFRS measurement classification and issuer
The table below analyses debt securities by issuer and IFRS measurement classifications. US central and local government includes US federal
agencies; financial institutions includes US government sponsored agencies and securitisation entities, the latter principally relating to asset-backed
securities (ABS).
Central and local government Other financial Of which
UK US Other Banks institutions Corporate Total ABS
2013 £m £m £m £m £m £m £m £m
Held-for-trading (HFT) 6,764 10,951 22,818 1,720 12,406 1,947 56,606 10,674
Designated as at fair value — — 104 — 17 1 122 15
A
vailable-for-sale 6,436 12,880 10,303 5,974 17,330 184 53,107 24,174
Loans and receivables 10 1 — 175 3,466 136 3,788 3,423
Long positions 13,210 23,832 33,225 7,869 33,219 2,268 113,623 38,286
Of which US agencies — 5,599 — — 13,132 — 18,731 18,048
Short positions (HFT) (1,784) (6,790) (16,087) (889) (1,387) (826) (27,763) (36)
A
vailable-for-sale
Gross unrealised gains 201 428 445 70 386 11 1,541 458
Gross unrealised losses (69) (86) (32) (205) (493) (2) (887) (753)
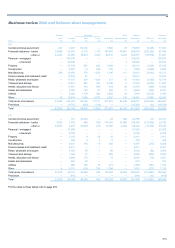
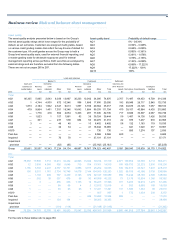
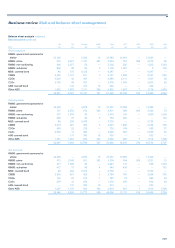
2012
Held-for-trading 7,692 17,349 27,195 2,243 21,876 2,015 78,370 18,619
Designated as at fair value — — 123 86 610 54 873 516
A
vailable-for-sale 9,774 19,046 16,155 8,861 23,890 3,167 80,893 30,743
Loans and receivables 5 — — 365 3,728 390 4,488 3,707
Long positions 17,471 36,395 43,473 11,555 50,104 5,626 164,624 53,585
Of which US agencies — 5,380 — — 21,566 — 26,946 24,828
Short positions (HFT) (1,538) (10,658) (11,355) (1,036) (1,595) (798) (26,980) (17)
A
vailable-for-sale
Gross unrealised gains 1,007 1,092 1,187 110 660 120 4,176 764
Gross unrealised losses — (1) (14) (509) (1,319) (4) (1,847) (1,817)
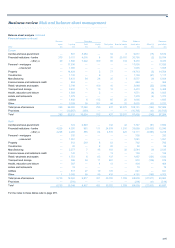
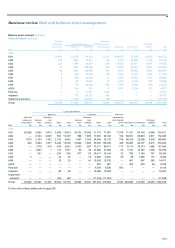
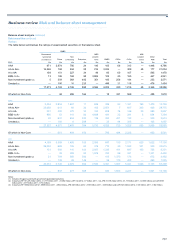
2011
Held-for-trading 9,004 19,636 36,928 3,400 23,160 2,948 95,076 20,816
Designated as at fair value 1 — 127 53 457 9 647 558
A
vailable-for-sale 13,436 20,848 25,552 13,175 31,752 2,535 107,298 40,735
Loans and receivables 10 — 1 312 5,259 477 6,059 5,200
Long positions 22,451 40,484 62,608 16,940 60,628 5,969 209,080 67,309
Of which US agencies — 4,896 — — 25,924 — 30,820 28,558
Short positions (HFT) (3,098) (10,661) (19,136) (2,556) (2,854) (754) (39,059) (352)
A
vailable-for-sale
Gross unrealised gains 1,428 1,311 1,180 52 913 94 4,978 1,001
Gross unrealised losses — — (171) (838) (2,386) (13) (3,408) (3,158)