RBS 2013 Annual Report Download - page 111
Download and view the complete annual report
Please find page 111 of the 2013 RBS annual report below. You can navigate through the pages in the report by either clicking on the pages listed below, or by using the keyword search tool below to find specific information within the annual report.-
 1
1 -
2
-
3
-
4
-
5
-
6
-
7
-
8
-
9
-
10
-
11
-
12
-
13
-
14
-
15
-
16
-
17
-
18
-
19
-
20
-
21
-
22
-
23
-
24
-
25
-
26
-
27
-
28
-
29
-
30
-
31
-
32
-
33
-
34
-
35
-
36
-
37
-
38
-
39
-
40
-
41
-
42
-
43
-
44
-
45
-
46
-
47
-
48
-
49
-
50
-
51
-
52
-
53
-
54
-
55
-
56
-
57
-
58
-
59
-
60
-
61
-
62
-
63
-
64
-
65
-
66
-
67
-
68
-
69
-
70
-
71
-
72
-
73
-
74
-
75
-
76
-
77
-
78
-
79
-
80
-
81
-
82
-
83
-
84
-
85
-
86
-
87
-
88
-
89
-
90
-
91
-
92
-
93
-
94
-
95
-
96
-
97
-
98
-
99
-
100
-
 101
101 -
 102
102 -
 103
103 -
 104
104 -
 105
105 -
 106
106 -
 107
107 -
 108
108 -
 109
109 -
 110
110 -
 111
111 -
 112
112 -
 113
113 -
 114
114 -
 115
115 -
 116
116 -
 117
117 -
 118
118 -
 119
119 -
 120
120 -
 121
121 -
122
-
123
-
124
-
125
-
126
-
127
-
128
-
129
-
130
-
131
-
132
-
133
-
134
-
135
-
136
-
137
-
138
-
139
-
140
-
141
-
142
-
143
-
144
-
145
-
146
-
147
-
148
-
149
-
150
-
151
-
152
-
153
-
154
-
155
-
156
-
157
-
158
-
159
-
160
-
161
-
162
-
163
-
164
-
165
-
166
-
167
-
168
-
169
-
170
-
171
-
172
-
173
-
174
-
175
-
176
-
177
-
178
-
179
-
180
-
181
-
182
-
183
-
184
-
185
-
186
-
187
-
188
-
189
-
190
-
191
-
192
-
193
-
194
-
195
-
196
-
197
-
198
-
199
-
200
-
201
-
202
-
203
-
204
-
205
-
206
-
207
-
208
-
209
-
210
-
211
-
212
-
213
-
214
-
215
-
216
-
217
-
218
-
219
-
220
-
221
-
222
-
223
-
224
-
225
-
226
-
227
-
228
-
229
-
230
-
231
-
232
-
233
-
234
-
235
-
236
-
237
-
238
-
239
-
240
-
241
-
242
-
243
-
244
-
245
-
246
-
247
-
248
-
249
-
250
-
251
-
252
-
253
-
254
-
255
-
256
-
257
-
258
-
259
-
260
-
261
-
262
-
263
-
264
-
265
-
266
-
267
-
268
-
269
-
270
-
271
-
272
-
273
-
274
-
275
-
276
-
277
-
278
-
279
-
280
-
281
-
282
-
283
-
284
-
285
-
286
-
287
-
288
-
289
-
290
-
291
-
292
-
293
-
294
-
295
-
296
-
297
-
298
-
299
-
300
-
301
-
302
-
303
-
304
-
305
-
306
-
307
-
308
-
309
-
310
-
311
-
312
-
313
-
314
-
315
-
316
-
317
-
318
-
319
-
320
-
321
-
322
-
323
-
324
-
325
-
326
-
327
-
328
-
329
-
330
-
331
-
332
-
333
-
334
-
335
-
336
-
337
-
338
-
339
-
340
-
341
-
342
-
343
-
344
-
345
-
346
-
347
-
348
-
349
-
350
-
351
-
352
-
353
-
354
-
355
-
356
-
357
-
358
-
359
-
360
-
361
-
362
-
363
-
364
-
365
-
366
-
367
-
368
-
369
-
370
-
371
-
372
-
373
-
374
-
375
-
376
-
377
-
378
-
379
-
380
-
381
-
382
-
383
-
384
-
385
-
386
-
387
-
388
-
389
-
390
-
391
-
392
-
393
-
394
-
395
-
396
-
397
-
398
-
399
-
400
-
401
-
402
-
403
-
404
-
405
-
406
-
407
-
408
-
409
-
410
-
411
-
412
-
413
-
414
-
415
-
416
-
417
-
418
-
419
-
420
-
421
-
422
-
423
-
424
-
425
-
426
-
427
-
428
-
429
-
430
-
431
-
432
-
433
-
434
-
435
-
436
-
437
-
438
-
439
-
440
-
441
-
442
-
443
-
444
-
445
-
446
-
447
-
448
-
449
-
450
-
451
-
452
-
453
-
454
-
455
-
456
-
457
-
458
-
459
-
460
-
461
-
462
-
463
-
464
-
465
-
466
-
467
-
468
-
469
-
470
-
471
-
472
-
473
-
474
-
475
-
476
-
477
-
478
-
479
-
480
-
481
-
482
-
483
-
484
-
485
-
486
-
487
-
488
-
489
-
490
-
491
-
492
-
493
-
494
-
495
-
496
-
497
-
498
-
499
-
500
-
501
-
502
-
503
-
504
-
505
-
506
-
507
-
508
-
509
-
510
-
511
-
512
-
513
-
514
-
515
-
516
-
517
-
518
-
519
-
520
-
521
-
522
-
523
-
524
-
525
-
526
-
527
-
528
-
529
-
530
-
531
-
532
-
533
-
534
-
535
-
536
-
537
-
538
-
539
-
540
-
541
-
542
-
543
-
544
-
545
-
546
-
547
-
548
-
549
-
550
-
551
-
552
-
553
-
554
-
555
-
556
-
557
-
558
-
559
-
560
-
561
-
562
-
563
-
564
 |
 |

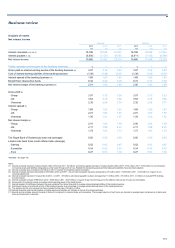
Business review
109
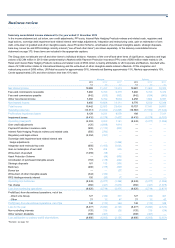
Key financials
Managed Statutory
2013 2012* 2011* 2013 2012* 2011*
for the year ended 31 December £m £m £m £m £m £m
Total income (1) 19,442 22,085 23,424 19,757 17,941 24,651
Profit before impairment losses (2) 6,129 8,231 8,578 189 2 7,311
Impairment losses (3) (8,432) (5,279) (7,437) (8,432) (5,279) (8,707)
Operating (loss)/profit (2) (2,303) 2,952 1,141 (8,243) (5,277) (1,396)
Loss attributable to ordinary and B shareholders (8,995) (6,055) (2,151) (8,995) (6,055) (2,151)
Cost:income ratio (4) 68% 63% 63% 99% 100% 70%
Basic loss per ordinary and equivalent B share from continuing
operations (pence) (81.3p) (54.5p) (22.7p) (81.3p) (54.5p) (22.7p)
A
djusted (loss)/earnings per ordinary and equivalent B share from
continuing operations (pence) (5) (38.3p) 4.3p (2.7p) n/a n/a n/a
*Restated – see page 102.
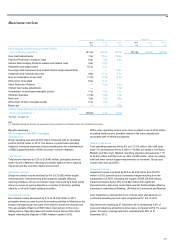
Managed and Statutory
2013 2012 2011
At 31 December £m £m £m
Funded balance sheet (6) 739,839 870,392 977,249
Total assets 1,027,878 1,312,295 1,506,867
Loans and advances to customers 440,722 500,135 515,606
Deposits (7) 534,859 622,684 611,759
Owners' equity 58,742 68,678 75,367
Risk asset ratios - Core Tier 1 10.9% 10.3% 10.6%
- Tier 1 13.1% 12.4% 13.0%
- Total 16.5% 14.5% 13.8%
Notes:
(1) Total income on a managed basis excludes own credit adjustments, gain on redemption of own debt, Asset Protection Scheme, strategic disposals and RFS MI. In the statutory consolidated income
statement, these items are included in total income.
(2) Operating (loss)/profit on a managed basis excludes own credit adjustments, PPI costs, Interest Rate Hedging Products redress and related costs, regulatory and legal actions, sovereign debt
impairment and related interest rate hedge adjustments, integration and restructuring costs, gain on redemption of own debt, write-down of goodwill and other intangible assets, Asset Protection
Scheme, amortisation of purchased intangible assets, strategic disposals, bank levy, bonus tax and RFS MI.
(3) Impairment losses on a managed basis excludes sovereign debt impairment and related interest rate hedge adjustments.
(4) Cost:income ratio on a managed basis represents operating expenses excluding PPI costs, Interest Rate Hedging Products redress and related costs, regulatory and legal actions, integration and
restructuring costs, write-down of goodwill and other intangible assets, amortisation of purchased intangible assets, bank levy, bonus tax and RFS MI, expressed as a percentage of total income as
defined in (1) above. On a statutory basis, cost:income ratio represents operating expenses expressed as a percentage of total income.
(5) Adjusted (loss)/earnings per ordinary and equivalent B share is based on earnings from continuing operations adjusted for own credit adjustments, PPI costs, Interest Rate Hedging Products redress
and related costs, regulatory and legal actions, sovereign debt impairment and related interest rate hedge adjustments, integration and restructuring costs, gain on redemption of own debt, write-
down of goodwill and other intangible assets, Asset Protection Scheme, amortisation of purchased intangible assets, strategic disposals, bank levy and bonus tax. Adjusted earnings per ordinary and
equivalent B share excludes the participation rights of the dividend access share.
(6) Funded balance sheet represents total assets less derivatives.
(7) Comprises deposits by banks and customer accounts.
Overview of results
The financial information on a managed basis, prepared using the Group’s accounting policies, shows the underlying performance of the Group which
excludes certain one-off and other items. This information is provided to give a better understanding of the results of the Group’s operations.