RBS 2013 Annual Report Download - page 311
Download and view the complete annual report
Please find page 311 of the 2013 RBS annual report below. You can navigate through the pages in the report by either clicking on the pages listed below, or by using the keyword search tool below to find specific information within the annual report.-
 1
1 -
2
-
3
-
4
-
5
-
6
-
7
-
8
-
9
-
10
-
11
-
12
-
13
-
14
-
15
-
16
-
17
-
18
-
19
-
20
-
21
-
22
-
23
-
24
-
25
-
26
-
27
-
28
-
29
-
30
-
31
-
32
-
33
-
34
-
35
-
36
-
37
-
38
-
39
-
40
-
41
-
42
-
43
-
44
-
45
-
46
-
47
-
48
-
49
-
50
-
51
-
52
-
53
-
54
-
55
-
56
-
57
-
58
-
59
-
60
-
61
-
62
-
63
-
64
-
65
-
66
-
67
-
68
-
69
-
70
-
71
-
72
-
73
-
74
-
75
-
76
-
77
-
78
-
79
-
80
-
81
-
82
-
83
-
84
-
85
-
86
-
87
-
88
-
89
-
90
-
91
-
92
-
93
-
94
-
95
-
96
-
97
-
98
-
99
-
100
-
101
-
102
-
103
-
104
-
105
-
106
-
107
-
108
-
109
-
110
-
111
-
112
-
113
-
114
-
115
-
116
-
117
-
118
-
119
-
120
-
121
-
122
-
123
-
124
-
125
-
126
-
127
-
128
-
129
-
130
-
131
-
132
-
133
-
134
-
135
-
136
-
137
-
138
-
139
-
140
-
141
-
142
-
143
-
144
-
145
-
146
-
147
-
148
-
149
-
150
-
151
-
152
-
153
-
154
-
155
-
156
-
157
-
158
-
159
-
160
-
161
-
162
-
163
-
164
-
165
-
166
-
167
-
168
-
169
-
170
-
171
-
172
-
173
-
174
-
175
-
176
-
177
-
178
-
179
-
180
-
181
-
182
-
183
-
184
-
185
-
186
-
187
-
188
-
189
-
190
-
191
-
192
-
193
-
194
-
195
-
196
-
197
-
198
-
199
-
200
-
201
-
202
-
203
-
204
-
205
-
206
-
207
-
208
-
209
-
210
-
211
-
212
-
213
-
214
-
215
-
216
-
217
-
218
-
219
-
220
-
221
-
222
-
223
-
224
-
225
-
226
-
227
-
228
-
229
-
230
-
231
-
232
-
233
-
234
-
235
-
236
-
237
-
238
-
239
-
240
-
241
-
242
-
243
-
244
-
245
-
246
-
247
-
248
-
249
-
250
-
251
-
252
-
253
-
254
-
255
-
256
-
257
-
258
-
259
-
260
-
261
-
262
-
263
-
264
-
265
-
266
-
267
-
268
-
269
-
270
-
271
-
272
-
273
-
274
-
275
-
276
-
277
-
278
-
279
-
280
-
281
-
282
-
283
-
284
-
285
-
286
-
287
-
288
-
289
-
290
-
291
-
292
-
293
-
294
-
295
-
296
-
297
-
298
-
299
-
300
-
 301
301 -
 302
302 -
 303
303 -
 304
304 -
 305
305 -
 306
306 -
 307
307 -
 308
308 -
 309
309 -
 310
310 -
 311
311 -
 312
312 -
 313
313 -
 314
314 -
 315
315 -
 316
316 -
 317
317 -
 318
318 -
 319
319 -
 320
320 -
 321
321 -
322
-
323
-
324
-
325
-
326
-
327
-
328
-
329
-
330
-
331
-
332
-
333
-
334
-
335
-
336
-
337
-
338
-
339
-
340
-
341
-
342
-
343
-
344
-
345
-
346
-
347
-
348
-
349
-
350
-
351
-
352
-
353
-
354
-
355
-
356
-
357
-
358
-
359
-
360
-
361
-
362
-
363
-
364
-
365
-
366
-
367
-
368
-
369
-
370
-
371
-
372
-
373
-
374
-
375
-
376
-
377
-
378
-
379
-
380
-
381
-
382
-
383
-
384
-
385
-
386
-
387
-
388
-
389
-
390
-
391
-
392
-
393
-
394
-
395
-
396
-
397
-
398
-
399
-
400
-
401
-
402
-
403
-
404
-
405
-
406
-
407
-
408
-
409
-
410
-
411
-
412
-
413
-
414
-
415
-
416
-
417
-
418
-
419
-
420
-
421
-
422
-
423
-
424
-
425
-
426
-
427
-
428
-
429
-
430
-
431
-
432
-
433
-
434
-
435
-
436
-
437
-
438
-
439
-
440
-
441
-
442
-
443
-
444
-
445
-
446
-
447
-
448
-
449
-
450
-
451
-
452
-
453
-
454
-
455
-
456
-
457
-
458
-
459
-
460
-
461
-
462
-
463
-
464
-
465
-
466
-
467
-
468
-
469
-
470
-
471
-
472
-
473
-
474
-
475
-
476
-
477
-
478
-
479
-
480
-
481
-
482
-
483
-
484
-
485
-
486
-
487
-
488
-
489
-
490
-
491
-
492
-
493
-
494
-
495
-
496
-
497
-
498
-
499
-
500
-
501
-
502
-
503
-
504
-
505
-
506
-
507
-
508
-
509
-
510
-
511
-
512
-
513
-
514
-
515
-
516
-
517
-
518
-
519
-
520
-
521
-
522
-
523
-
524
-
525
-
526
-
527
-
528
-
529
-
530
-
531
-
532
-
533
-
534
-
535
-
536
-
537
-
538
-
539
-
540
-
541
-
542
-
543
-
544
-
545
-
546
-
547
-
548
-
549
-
550
-
551
-
552
-
553
-
554
-
555
-
556
-
557
-
558
-
559
-
560
-
561
-
562
-
563
-
564
 |
 |

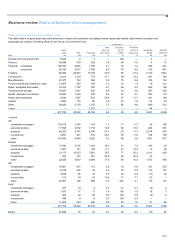
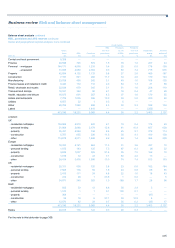
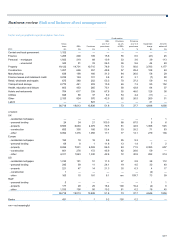
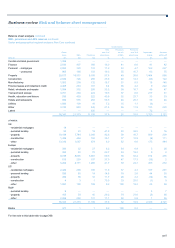
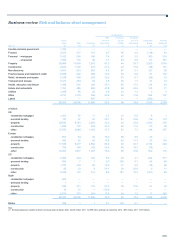
Business review Risk and balance sheet management
309
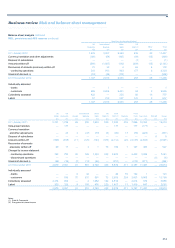
Credit metrics
REIL Provisions Provisions
Gross as a % of as a % as a % of Impairment Amounts
loans REIL Provisions gross loans of REIL gross loans charge written-off
2011 (1) £m £m £m %% % £m £m
Central and local government 1,383 — — — — — — —
Finance 3,272 317 147 9.7 46 4.5 (118) 43
Personal - mortgages 5,102 380 180 7.4 47 3.5 300 318
- unsecured 1,556 110 92 7.1 84 5.9 67 351
Property 38,064 17,969 7,861 47.2 44 20.7 3,200 1,004
Construction 2,672 1,102 475 41.2 43 17.8 (39) 101
Manufacturing 4,931 423 283 8.6 67 5.7 121 90
Finance leases and instalment credit 6,059 622 398 10.3 64 6.6 81 102
Retail, wholesale and repairs 2,339 388 204 16.6 53 8.7 (28) 53
Transport and storage 5,477 264 94 4.8 36 1.7 31 14
Health, education and leisure 1,419 501 245 35.3 49 17.3 134 43
Hotels and restaurants 1,161 485 289 41.8 60 24.9 125 71
Utilities 1,849 66 22 3.6 33 1.2 3 3
Other 4,721 1,379 549 29.2 40 11.6 254 197
Latent — — 647 — — — (293) —
80,005 24,006 11,486 30.0 48 14.4 3,838 2,390
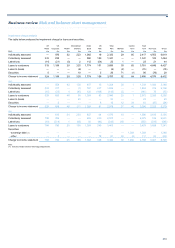
of which:
UK
- residential mortgages 1,423 52 11 3.7 21 0.8 6 1
- personal lending 127 37 30 29.1 81 23.6 (12) 179
- property 24,610 8,163 3,093 33.2 38 12.6 1,033 379
- construction 1,882 772 324 41.0 42 17.2 27 90
- other 17,670 2,064 1,295 11.7 63 7.3 148 257
Europe
- residential mortgages 553 84 49 15.2 58 8.9 30 —
- personal lending 492 66 55 13.4 83 11.2 33 104
- property 11,538 9,277 4,582 80.4 49 39.7 2,134 494
- construction 735 290 142 39.5 49 19.3 (75) —
- other 10,083 1,831 1,067 18.2 58 10.6 352 110
US
- residential mortgages 2,926 244 120 8.3 49 4.1 264 317
- personal lending 936 77 0.7 100 0.7 46 68
- property 1,370 218 68 15.9 31 5.0 (18) 96
- construction 45 23 9 51.1 39 20.0 9 11
- other 2,044 172 312 8.4 181 15.3 (201) 84
RoW
- residential mortgages 200 — — — — — — —
- personal lending 1 — — — — — — —
- property 546 311 118 57.0 38 21.6 51 35
- construction 10 17 — 170.0 — — — —
- other 2,814 378 204 13.4 54 7.2 11 165
80,005 24,006 11,486 30.0 48 14.4 3,838 2,390
Banks 706 11 0.1 100 0.1 — —
Note:
(1) Excludes balances in relation to Direct Line Group (loans to banks: 2012 - £2,036 million; 2011 - £2,559 million and loans to customers: 2012 - £881 million; 2011 - £873 million).