RBS 2013 Annual Report Download - page 30
Download and view the complete annual report
Please find page 30 of the 2013 RBS annual report below. You can navigate through the pages in the report by either clicking on the pages listed below, or by using the keyword search tool below to find specific information within the annual report.-
 1
1 -
2
-
3
-
4
-
5
-
6
-
7
-
8
-
9
-
10
-
11
-
12
-
13
-
14
-
15
-
16
-
17
-
18
-
19
-
 20
20 -
 21
21 -
 22
22 -
 23
23 -
 24
24 -
 25
25 -
 26
26 -
 27
27 -
 28
28 -
 29
29 -
 30
30 -
 31
31 -
 32
32 -
 33
33 -
 34
34 -
 35
35 -
 36
36 -
 37
37 -
 38
38 -
 39
39 -
 40
40 -
41
-
42
-
43
-
44
-
45
-
46
-
47
-
48
-
49
-
50
-
51
-
52
-
53
-
54
-
55
-
56
-
57
-
58
-
59
-
60
-
61
-
62
-
63
-
64
-
65
-
66
-
67
-
68
-
69
-
70
-
71
-
72
-
73
-
74
-
75
-
76
-
77
-
78
-
79
-
80
-
81
-
82
-
83
-
84
-
85
-
86
-
87
-
88
-
89
-
90
-
91
-
92
-
93
-
94
-
95
-
96
-
97
-
98
-
99
-
100
-
101
-
102
-
103
-
104
-
105
-
106
-
107
-
108
-
109
-
110
-
111
-
112
-
113
-
114
-
115
-
116
-
117
-
118
-
119
-
120
-
121
-
122
-
123
-
124
-
125
-
126
-
127
-
128
-
129
-
130
-
131
-
132
-
133
-
134
-
135
-
136
-
137
-
138
-
139
-
140
-
141
-
142
-
143
-
144
-
145
-
146
-
147
-
148
-
149
-
150
-
151
-
152
-
153
-
154
-
155
-
156
-
157
-
158
-
159
-
160
-
161
-
162
-
163
-
164
-
165
-
166
-
167
-
168
-
169
-
170
-
171
-
172
-
173
-
174
-
175
-
176
-
177
-
178
-
179
-
180
-
181
-
182
-
183
-
184
-
185
-
186
-
187
-
188
-
189
-
190
-
191
-
192
-
193
-
194
-
195
-
196
-
197
-
198
-
199
-
200
-
201
-
202
-
203
-
204
-
205
-
206
-
207
-
208
-
209
-
210
-
211
-
212
-
213
-
214
-
215
-
216
-
217
-
218
-
219
-
220
-
221
-
222
-
223
-
224
-
225
-
226
-
227
-
228
-
229
-
230
-
231
-
232
-
233
-
234
-
235
-
236
-
237
-
238
-
239
-
240
-
241
-
242
-
243
-
244
-
245
-
246
-
247
-
248
-
249
-
250
-
251
-
252
-
253
-
254
-
255
-
256
-
257
-
258
-
259
-
260
-
261
-
262
-
263
-
264
-
265
-
266
-
267
-
268
-
269
-
270
-
271
-
272
-
273
-
274
-
275
-
276
-
277
-
278
-
279
-
280
-
281
-
282
-
283
-
284
-
285
-
286
-
287
-
288
-
289
-
290
-
291
-
292
-
293
-
294
-
295
-
296
-
297
-
298
-
299
-
300
-
301
-
302
-
303
-
304
-
305
-
306
-
307
-
308
-
309
-
310
-
311
-
312
-
313
-
314
-
315
-
316
-
317
-
318
-
319
-
320
-
321
-
322
-
323
-
324
-
325
-
326
-
327
-
328
-
329
-
330
-
331
-
332
-
333
-
334
-
335
-
336
-
337
-
338
-
339
-
340
-
341
-
342
-
343
-
344
-
345
-
346
-
347
-
348
-
349
-
350
-
351
-
352
-
353
-
354
-
355
-
356
-
357
-
358
-
359
-
360
-
361
-
362
-
363
-
364
-
365
-
366
-
367
-
368
-
369
-
370
-
371
-
372
-
373
-
374
-
375
-
376
-
377
-
378
-
379
-
380
-
381
-
382
-
383
-
384
-
385
-
386
-
387
-
388
-
389
-
390
-
391
-
392
-
393
-
394
-
395
-
396
-
397
-
398
-
399
-
400
-
401
-
402
-
403
-
404
-
405
-
406
-
407
-
408
-
409
-
410
-
411
-
412
-
413
-
414
-
415
-
416
-
417
-
418
-
419
-
420
-
421
-
422
-
423
-
424
-
425
-
426
-
427
-
428
-
429
-
430
-
431
-
432
-
433
-
434
-
435
-
436
-
437
-
438
-
439
-
440
-
441
-
442
-
443
-
444
-
445
-
446
-
447
-
448
-
449
-
450
-
451
-
452
-
453
-
454
-
455
-
456
-
457
-
458
-
459
-
460
-
461
-
462
-
463
-
464
-
465
-
466
-
467
-
468
-
469
-
470
-
471
-
472
-
473
-
474
-
475
-
476
-
477
-
478
-
479
-
480
-
481
-
482
-
483
-
484
-
485
-
486
-
487
-
488
-
489
-
490
-
491
-
492
-
493
-
494
-
495
-
496
-
497
-
498
-
499
-
500
-
501
-
502
-
503
-
504
-
505
-
506
-
507
-
508
-
509
-
510
-
511
-
512
-
513
-
514
-
515
-
516
-
517
-
518
-
519
-
520
-
521
-
522
-
523
-
524
-
525
-
526
-
527
-
528
-
529
-
530
-
531
-
532
-
533
-
534
-
535
-
536
-
537
-
538
-
539
-
540
-
541
-
542
-
543
-
544
-
545
-
546
-
547
-
548
-
549
-
550
-
551
-
552
-
553
-
554
-
555
-
556
-
557
-
558
-
559
-
560
-
561
-
562
-
563
-
564
 |
 |
It has been noted before that when economies
are emerging from recessions rooted in high
levels of debt and stresses in the financial
system, growth is slower than in the typical
recovery. That was the experience again
in 2013 in the major markets in which RBS
operates.
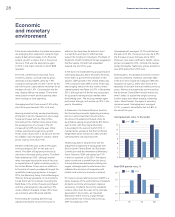
In the UK, performance improved. Total
economic activity, as measured by gross
domestic product (GDP), grew by 1.9%
compared with growth of 0.3% in 2012. At the
start of the year, expectations had been for an
increase of only 1.0%. Consumption led the
way, despite falling real wages. There were
more people in work and households drew
down savings to fund spending.
Unemployment fell, from around 7.9% at the
start of the year towards 7.0% at its end.
Housing market activity accelerated sharply,
prompted in part by measures to encourage
house purchases such as Help to Buy.
According to the Halifax house price index,
the average price of a house in the UK
increased by 5.8% during the year. Other
indices reported stronger price growth.
Prices look to have risen in all parts of the UK
but inflation was strongest in London, where
prices rose by more than 10%.
Inflation ended the year at the 2.0% target
having averaged 2.6% for the year as a
whole. The Bank of England continued its
ultra-loose monetary policy stance. The Bank
Rate remained at 0.5%, although market
rates increased towards the end of the year
on expectations of tighter monetary policy in
the United States. There were no additions
to the stock of assets purchased through the
quantitative easing programme. In August
2013, the Monetary Policy Committee began
offering ‘forward guidance’ on its intentions.
It said that it will not consider changing the
Bank Rate or the stock of assets purchased
until the unemployment rate reaches 7.0%,
unless inflation threatens to take off or there
are concerns about financial stability.
The Funding for Lending Scheme was
adjusted during the course of the year to
enhance the incentives for banks to lend
to small firms and later to withdraw that
support for lending to individuals. The Bank of
England’s Credit Conditions Survey suggested
that the supply of credit had expanded
towards the end of the year.
In the face of considerable fiscal austerity and
continuing disputes about the public finances,
which led to a government shutdown in the
autumn, GDP growth in the United States was
1.9% compared with 2.8% in 2012. There was
encouraging news on the job market, where
unemployment had fallen to 6.7% in December
2013, although part of the fall was accounted
for by people leaving the job market rather
than finding work. The housing market again
performed strongly, with prices up 14% in the
year to November.
In December, the Federal Reserve took the
first formal steps towards tightening monetary
policy. It announced that it would reduce
the amount of assets purchased under its
quantitative easing programme by $10 billion
each month, with the programme likely
to be ended in the second half of 2014. It
maintained its guidance that the Fed Funds
Target Rate would remain at 0.25% until the
unemployment rate reaches 6.5%.
Ireland was able in early 2014 to exit the
adjustment programme it had agreed with
the European Central Bank, the European
Commission and the International Monetary
Fund. However, GDP contracted by 0.7%
in the four quarters to Q3 2013. The export
sector continued to benefit from the boost
to competitiveness delivered by falling real
wages, although export performance also
reflected the decision of companies with
limited local activity to domicile in Ireland.
For Ireland, gross national product (GNP) is a
better measure of the performance of Ireland’s
domestic economy and people’s material
well-being. It reflects the income residents
receive rather than the value of the incomes
generated in the country, an important
distinction where there is a large foreign-
owned sector that remits profits overseas.
GNP increased by 2.7%.
Unemployment averaged 13.2% and finished
the year at 12.4%. House prices rose by 6.4%,
the first year-on-year increase since 2007.
However, rises were confined to Dublin, where
prices increased by 16%. Outside the capital,
prices fell slightly. Nationally, prices ended the
year 45% below their 2007 level.
Entering 2013, the greatest economic concern
was how problems related to sovereign debt
in the euro zone would be managed. With the
exception of Cyprus, there were none of the
episodes of concern that had marked previous
years. Markets were generally convinced that
the European Central Bank would indeed ‘do
what it takes’ to sustain the single currency.
Further steps were taken towards a banking
union. Nevertheless, the region’s economy
remained weak. Unemployment averaged
12.1%, a record, and inflation fell to 0.8% at
the end of the year.
Economic
and monetary
environment
28 Economic and monetary environment
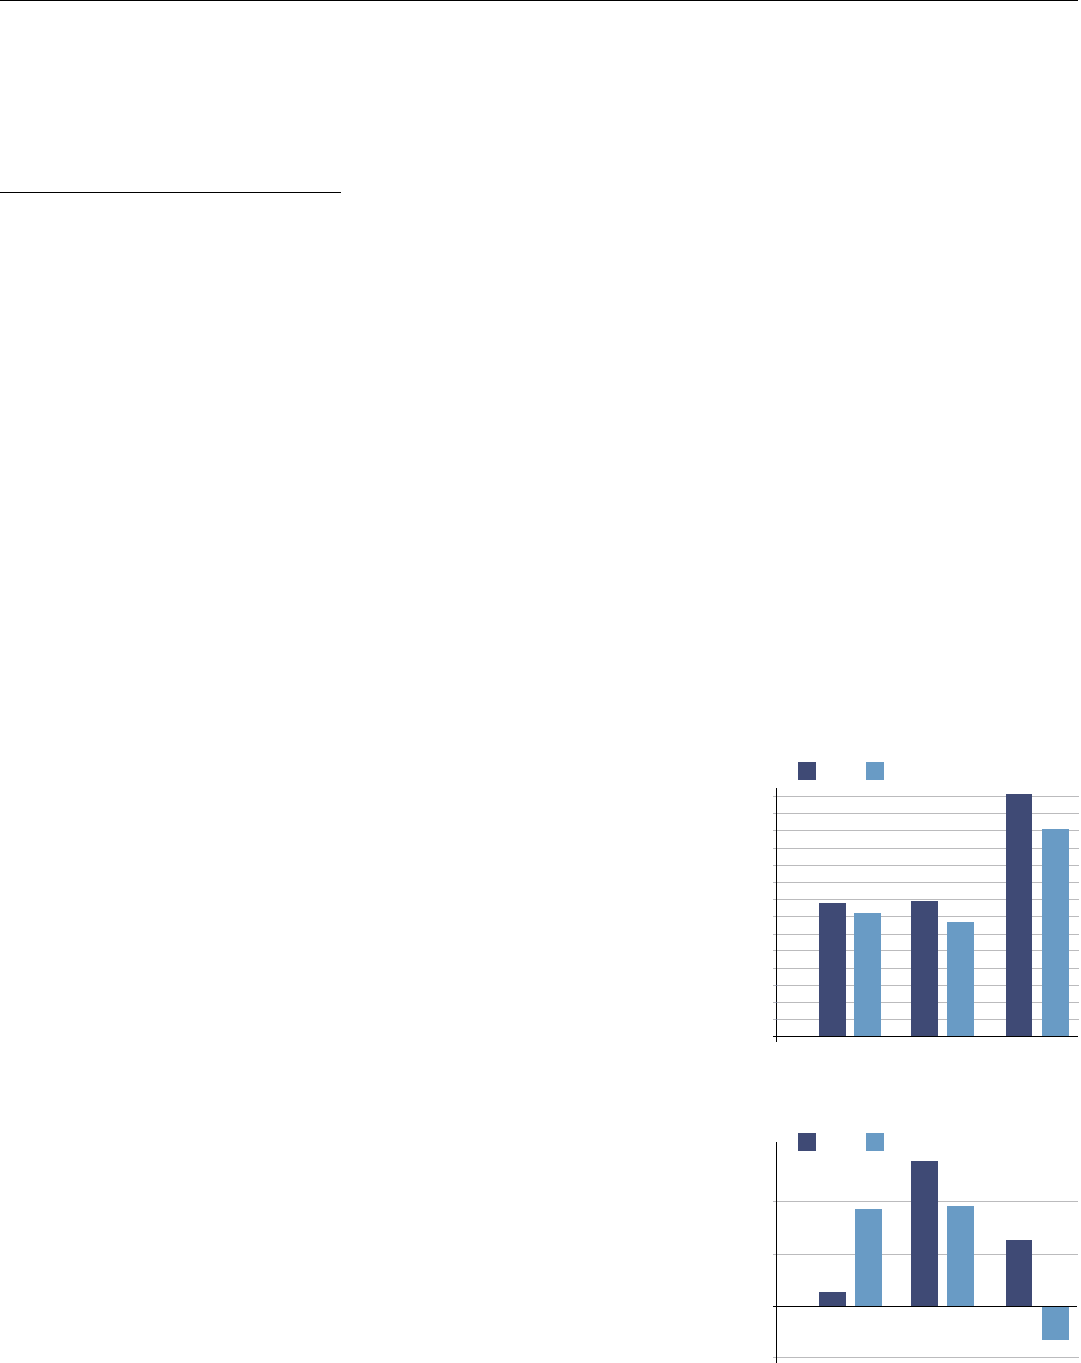
Unemployment rates, % December
Real GDP growth rates, %
UK US RoI
0%
3%
2%
1%
-1%
UK US RoI
14
12
10
8
6
4
2
0
2012 2013
2012 2013