RBS 2013 Annual Report Download - page 218
Download and view the complete annual report
Please find page 218 of the 2013 RBS annual report below. You can navigate through the pages in the report by either clicking on the pages listed below, or by using the keyword search tool below to find specific information within the annual report.-
 1
1 -
2
-
3
-
4
-
5
-
6
-
7
-
8
-
9
-
10
-
11
-
12
-
13
-
14
-
15
-
16
-
17
-
18
-
19
-
20
-
21
-
22
-
23
-
24
-
25
-
26
-
27
-
28
-
29
-
30
-
31
-
32
-
33
-
34
-
35
-
36
-
37
-
38
-
39
-
40
-
41
-
42
-
43
-
44
-
45
-
46
-
47
-
48
-
49
-
50
-
51
-
52
-
53
-
54
-
55
-
56
-
57
-
58
-
59
-
60
-
61
-
62
-
63
-
64
-
65
-
66
-
67
-
68
-
69
-
70
-
71
-
72
-
73
-
74
-
75
-
76
-
77
-
78
-
79
-
80
-
81
-
82
-
83
-
84
-
85
-
86
-
87
-
88
-
89
-
90
-
91
-
92
-
93
-
94
-
95
-
96
-
97
-
98
-
99
-
100
-
101
-
102
-
103
-
104
-
105
-
106
-
107
-
108
-
109
-
110
-
111
-
112
-
113
-
114
-
115
-
116
-
117
-
118
-
119
-
120
-
121
-
122
-
123
-
124
-
125
-
126
-
127
-
128
-
129
-
130
-
131
-
132
-
133
-
134
-
135
-
136
-
137
-
138
-
139
-
140
-
141
-
142
-
143
-
144
-
145
-
146
-
147
-
148
-
149
-
150
-
151
-
152
-
153
-
154
-
155
-
156
-
157
-
158
-
159
-
160
-
161
-
162
-
163
-
164
-
165
-
166
-
167
-
168
-
169
-
170
-
171
-
172
-
173
-
174
-
175
-
176
-
177
-
178
-
179
-
180
-
181
-
182
-
183
-
184
-
185
-
186
-
187
-
188
-
189
-
190
-
191
-
192
-
193
-
194
-
195
-
196
-
197
-
198
-
199
-
200
-
201
-
202
-
203
-
204
-
205
-
206
-
207
-
 208
208 -
 209
209 -
 210
210 -
 211
211 -
 212
212 -
 213
213 -
 214
214 -
 215
215 -
 216
216 -
 217
217 -
 218
218 -
 219
219 -
 220
220 -
 221
221 -
 222
222 -
 223
223 -
 224
224 -
 225
225 -
 226
226 -
 227
227 -
 228
228 -
229
-
230
-
231
-
232
-
233
-
234
-
235
-
236
-
237
-
238
-
239
-
240
-
241
-
242
-
243
-
244
-
245
-
246
-
247
-
248
-
249
-
250
-
251
-
252
-
253
-
254
-
255
-
256
-
257
-
258
-
259
-
260
-
261
-
262
-
263
-
264
-
265
-
266
-
267
-
268
-
269
-
270
-
271
-
272
-
273
-
274
-
275
-
276
-
277
-
278
-
279
-
280
-
281
-
282
-
283
-
284
-
285
-
286
-
287
-
288
-
289
-
290
-
291
-
292
-
293
-
294
-
295
-
296
-
297
-
298
-
299
-
300
-
301
-
302
-
303
-
304
-
305
-
306
-
307
-
308
-
309
-
310
-
311
-
312
-
313
-
314
-
315
-
316
-
317
-
318
-
319
-
320
-
321
-
322
-
323
-
324
-
325
-
326
-
327
-
328
-
329
-
330
-
331
-
332
-
333
-
334
-
335
-
336
-
337
-
338
-
339
-
340
-
341
-
342
-
343
-
344
-
345
-
346
-
347
-
348
-
349
-
350
-
351
-
352
-
353
-
354
-
355
-
356
-
357
-
358
-
359
-
360
-
361
-
362
-
363
-
364
-
365
-
366
-
367
-
368
-
369
-
370
-
371
-
372
-
373
-
374
-
375
-
376
-
377
-
378
-
379
-
380
-
381
-
382
-
383
-
384
-
385
-
386
-
387
-
388
-
389
-
390
-
391
-
392
-
393
-
394
-
395
-
396
-
397
-
398
-
399
-
400
-
401
-
402
-
403
-
404
-
405
-
406
-
407
-
408
-
409
-
410
-
411
-
412
-
413
-
414
-
415
-
416
-
417
-
418
-
419
-
420
-
421
-
422
-
423
-
424
-
425
-
426
-
427
-
428
-
429
-
430
-
431
-
432
-
433
-
434
-
435
-
436
-
437
-
438
-
439
-
440
-
441
-
442
-
443
-
444
-
445
-
446
-
447
-
448
-
449
-
450
-
451
-
452
-
453
-
454
-
455
-
456
-
457
-
458
-
459
-
460
-
461
-
462
-
463
-
464
-
465
-
466
-
467
-
468
-
469
-
470
-
471
-
472
-
473
-
474
-
475
-
476
-
477
-
478
-
479
-
480
-
481
-
482
-
483
-
484
-
485
-
486
-
487
-
488
-
489
-
490
-
491
-
492
-
493
-
494
-
495
-
496
-
497
-
498
-
499
-
500
-
501
-
502
-
503
-
504
-
505
-
506
-
507
-
508
-
509
-
510
-
511
-
512
-
513
-
514
-
515
-
516
-
517
-
518
-
519
-
520
-
521
-
522
-
523
-
524
-
525
-
526
-
527
-
528
-
529
-
530
-
531
-
532
-
533
-
534
-
535
-
536
-
537
-
538
-
539
-
540
-
541
-
542
-
543
-
544
-
545
-
546
-
547
-
548
-
549
-
550
-
551
-
552
-
553
-
554
-
555
-
556
-
557
-
558
-
559
-
560
-
561
-
562
-
563
-
564
 |
 |

Business review Risk and balance sheet management
216
Funding risk
Funding sources
The Group’s primary funding source is its customer deposit base,
primarily built through its retail and commercial franchises in the UK,
Ireland and the US. These deposits form a stable base which fully funds
the Group’s customer lending activities.
Complementary to its deposit funding, the Group also accesses various
wholesale markets for funding, on both a public and private basis. These
include long-term secured and unsecured debt, short-term money
markets and repurchase agreements. The Group has set policies for the
prudent use of wholesale funding, as part of its wider liquidity policies.
Maintaining access to global capital markets provides the Group’s
funding base with diversity. Over time the Group’s wholesale funding mix
has been diversified by currency, geography, maturity and type. The
Group accesses the wholesale funding markets directly or through its
main operating subsidiaries via established funding programmes. The
use of different entities to access the market from time to time allows the
Group to further diversify its funding mix and in certain limited
circumstances demonstrate to regulators that specific operating
subsidiaries enjoy market access in their own right.
The Group may access various funding facilities offered by central banks
from time to time. The use of such facilities can be both part of a wider
strategic objective to support initiatives to help stimulate economic growth
or as part of the Group’s broader liquidity management and funding
strategy. Overall usage and repayment of available central bank facilities
will fit within the Group’s overall liquidity risk appetite and concentration
limits.
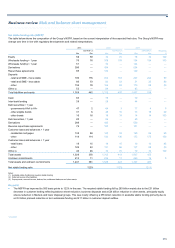
During 2013, the Group repaid €8.5 billion of the original €10 billion
borrowed under the European Central Bank’s Long Term Refinancing
Operation. The remaining balance is used to fund certain of the Group’s
Eurozone banking subsidiaries and the usage of this facility will be
evaluated on an ongoing basis. The Group has not drawn down any
additional funds under the Bank of England’s Funding for Lending
Scheme during the year and has repaid the initial drawing of £750 million
in order to manage its excess cash position. The Group remains
committed to supporting the objectives of the Funding for Lending
scheme.
Analysis
Funding sources
The Group’s balance sheet composition is a function of the broad array of
product offerings and diverse markets served by its core divisions. The
structural composition of the balance sheet is augmented as needed
through active management of both asset and liability portfolios. The
objective of these activities is to optimise the liquidity profile in the normal
business environment, while ensuring adequate coverage of all cash
requirements under extreme stress conditions.
As set out below the Group’s asset and liability types broadly match.
Customer deposits provide more funding than customer loans absorb;
repurchase agreements are largely covered by reverse repurchase
agreements; interbank lending and funding largely match each other and
this gap has narrowed over the past five years; and derivative assets are
largely matched against derivative liabilities.
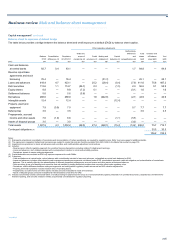
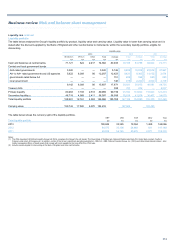
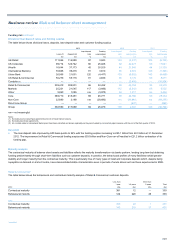
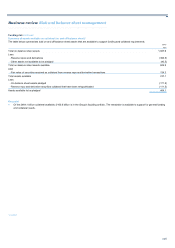
The table below shows the Group’s sources and uses of funding.
2013
Liabilities Assets
£bn £bn
Customer deposits (1) 407 373 Customer loans and advances (1)
Bank deposits (short-term only) (1) 14 18 Loan and advances to banks (1)
Trading liabilities (2) 67 93 Trading assets (2)
Other liabilities and equity (3) 100 90 Other assets (3)
Repurchase agreements 85 76 Reverse repurchase agreements
Term wholesale funding (1) 69 90 Primary liquidity portfolio
Funded balance sheet 742 740 Funded balance sheet
Derivatives 286 288 Derivatives
1,028 1,028
Notes:
(1) Excludes held for trading.
(2) Financial instruments classified as held-for-trading (HFT) excluding security financing transactions and derivatives.
(3) Includes non-HFT financial instruments and non-financial assets/liabilities.