RBS 2013 Annual Report Download - page 404
Download and view the complete annual report
Please find page 404 of the 2013 RBS annual report below. You can navigate through the pages in the report by either clicking on the pages listed below, or by using the keyword search tool below to find specific information within the annual report.-
 1
1 -
2
-
3
-
4
-
5
-
6
-
7
-
8
-
9
-
10
-
11
-
12
-
13
-
14
-
15
-
16
-
17
-
18
-
19
-
20
-
21
-
22
-
23
-
24
-
25
-
26
-
27
-
28
-
29
-
30
-
31
-
32
-
33
-
34
-
35
-
36
-
37
-
38
-
39
-
40
-
41
-
42
-
43
-
44
-
45
-
46
-
47
-
48
-
49
-
50
-
51
-
52
-
53
-
54
-
55
-
56
-
57
-
58
-
59
-
60
-
61
-
62
-
63
-
64
-
65
-
66
-
67
-
68
-
69
-
70
-
71
-
72
-
73
-
74
-
75
-
76
-
77
-
78
-
79
-
80
-
81
-
82
-
83
-
84
-
85
-
86
-
87
-
88
-
89
-
90
-
91
-
92
-
93
-
94
-
95
-
96
-
97
-
98
-
99
-
100
-
101
-
102
-
103
-
104
-
105
-
106
-
107
-
108
-
109
-
110
-
111
-
112
-
113
-
114
-
115
-
116
-
117
-
118
-
119
-
120
-
121
-
122
-
123
-
124
-
125
-
126
-
127
-
128
-
129
-
130
-
131
-
132
-
133
-
134
-
135
-
136
-
137
-
138
-
139
-
140
-
141
-
142
-
143
-
144
-
145
-
146
-
147
-
148
-
149
-
150
-
151
-
152
-
153
-
154
-
155
-
156
-
157
-
158
-
159
-
160
-
161
-
162
-
163
-
164
-
165
-
166
-
167
-
168
-
169
-
170
-
171
-
172
-
173
-
174
-
175
-
176
-
177
-
178
-
179
-
180
-
181
-
182
-
183
-
184
-
185
-
186
-
187
-
188
-
189
-
190
-
191
-
192
-
193
-
194
-
195
-
196
-
197
-
198
-
199
-
200
-
201
-
202
-
203
-
204
-
205
-
206
-
207
-
208
-
209
-
210
-
211
-
212
-
213
-
214
-
215
-
216
-
217
-
218
-
219
-
220
-
221
-
222
-
223
-
224
-
225
-
226
-
227
-
228
-
229
-
230
-
231
-
232
-
233
-
234
-
235
-
236
-
237
-
238
-
239
-
240
-
241
-
242
-
243
-
244
-
245
-
246
-
247
-
248
-
249
-
250
-
251
-
252
-
253
-
254
-
255
-
256
-
257
-
258
-
259
-
260
-
261
-
262
-
263
-
264
-
265
-
266
-
267
-
268
-
269
-
270
-
271
-
272
-
273
-
274
-
275
-
276
-
277
-
278
-
279
-
280
-
281
-
282
-
283
-
284
-
285
-
286
-
287
-
288
-
289
-
290
-
291
-
292
-
293
-
294
-
295
-
296
-
297
-
298
-
299
-
300
-
301
-
302
-
303
-
304
-
305
-
306
-
307
-
308
-
309
-
310
-
311
-
312
-
313
-
314
-
315
-
316
-
317
-
318
-
319
-
320
-
321
-
322
-
323
-
324
-
325
-
326
-
327
-
328
-
329
-
330
-
331
-
332
-
333
-
334
-
335
-
336
-
337
-
338
-
339
-
340
-
341
-
342
-
343
-
344
-
345
-
346
-
347
-
348
-
349
-
350
-
351
-
352
-
353
-
354
-
355
-
356
-
357
-
358
-
359
-
360
-
361
-
362
-
363
-
364
-
365
-
366
-
367
-
368
-
369
-
370
-
371
-
372
-
373
-
374
-
375
-
376
-
377
-
378
-
379
-
380
-
381
-
382
-
383
-
384
-
385
-
386
-
387
-
388
-
389
-
390
-
391
-
392
-
393
-
 394
394 -
 395
395 -
 396
396 -
 397
397 -
 398
398 -
 399
399 -
 400
400 -
 401
401 -
 402
402 -
 403
403 -
 404
404 -
 405
405 -
 406
406 -
 407
407 -
 408
408 -
 409
409 -
 410
410 -
 411
411 -
 412
412 -
 413
413 -
 414
414 -
415
-
416
-
417
-
418
-
419
-
420
-
421
-
422
-
423
-
424
-
425
-
426
-
427
-
428
-
429
-
430
-
431
-
432
-
433
-
434
-
435
-
436
-
437
-
438
-
439
-
440
-
441
-
442
-
443
-
444
-
445
-
446
-
447
-
448
-
449
-
450
-
451
-
452
-
453
-
454
-
455
-
456
-
457
-
458
-
459
-
460
-
461
-
462
-
463
-
464
-
465
-
466
-
467
-
468
-
469
-
470
-
471
-
472
-
473
-
474
-
475
-
476
-
477
-
478
-
479
-
480
-
481
-
482
-
483
-
484
-
485
-
486
-
487
-
488
-
489
-
490
-
491
-
492
-
493
-
494
-
495
-
496
-
497
-
498
-
499
-
500
-
501
-
502
-
503
-
504
-
505
-
506
-
507
-
508
-
509
-
510
-
511
-
512
-
513
-
514
-
515
-
516
-
517
-
518
-
519
-
520
-
521
-
522
-
523
-
524
-
525
-
526
-
527
-
528
-
529
-
530
-
531
-
532
-
533
-
534
-
535
-
536
-
537
-
538
-
539
-
540
-
541
-
542
-
543
-
544
-
545
-
546
-
547
-
548
-
549
-
550
-
551
-
552
-
553
-
554
-
555
-
556
-
557
-
558
-
559
-
560
-
561
-
562
-
563
-
564
 |
 |

Notes on the consolidated accounts
402
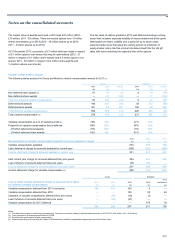
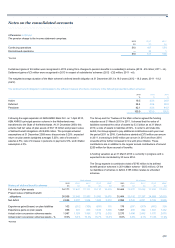
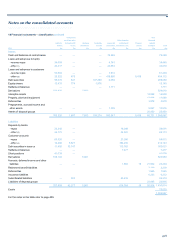
4 Pensions continued
The pension charge to the income statement comprises:
2013 2012* 2011*
£m £m £m
Continuing operations 510 487 554
Discontinued operations — 30 1
510 517 555
*Restated
Curtailment gains of £4 million were recognised in 2013 arising from changes to pension benefits in a subsidiary’s scheme (2012 - £9 million; 2011 - nil).
Settlement gains of £3 million were recognised in 2013 in respect of subsidiaries’ schemes (2012 - £32 million; 2011 - nil).
The weighted average duration of the Main scheme’s defined benefit obligation at 31 December 2013 is 18.0 years (2012 - 19.2 years; 2011 - 18.2
years).
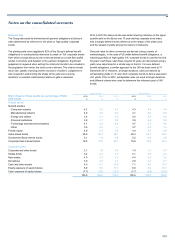
The defined benefit obligation is attributable to the different classes of scheme members in the following proportions (Main scheme):
2013 2012 2011
% % %
A
ctive 19.5 23.8 24.8
Deferred 38.4 32.4 30.9
Pensioner 42.1 43.8 44.3
100.0 100.0 100.0
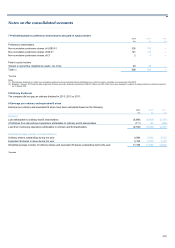
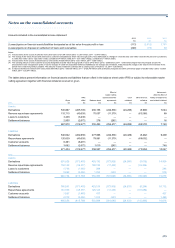
Following the legal separation of ABN AMRO Bank N.V. on 1 April 2010,
ABN AMRO’s principal pension scheme in the Netherlands was
transferred to the State of the Netherlands. At 31 December 2009, this
scheme had fair value of plan assets of £8,118 million and present value
of defined benefit obligations of £8,298 million. The principal actuarial
assumptions at 31 December 2009 were: discount rate 5.25%; expected
return on plan assets (weighted average) 5.25%; rate of increase in
salaries 2.5%; rate of increase in pensions in payment 2.0%; and inflation
assumption 2.0%.
The Group and the Trustees of the Main scheme agreed the funding
valuation as at 31 March 2010 in 2011. It showed that the value of
liabilities exceeded the value of assets by £3.5 billion as at 31 March
2010, a ratio of assets to liabilities of 84%. In order to eliminate this
deficit, the Group agreed to pay additional contributions each year over
the period 2011 to 2018. Contributions started at £375 million per annum
in 2011, increasing to £400 million per annum in 2013 and from 2016
onwards will be further increased in line with price inflation. These
contributions are in addition to the regular annual contributions of around
£250 million for future accrual of benefits.
A funding valuation as at 31 March 2013 is currently in progress and is
expected to be concluded by 30 June 2014.
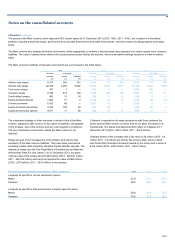
The Group expects to contribute a total of £785 million to its defined
benefit pension schemes in 2014 (Main scheme - £633 million). Of the
net liabilities of schemes in deficit, £155 million relates to unfunded
schemes.
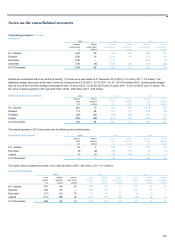
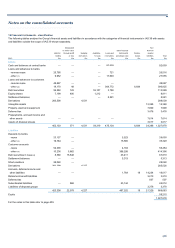
Main scheme All schemes
2013 2012* 2011* 2010* 2009* 2013 2012* 2011* 2010* 2009*
History of defined benefit schemes £m £m £m £m £m £m £m £m £m £m
Fair value of plan assets 24,272 22,441 21,111 19,110 16,603 28,488 26,370 25,086 22,816 27,925
Present value of defined benefit
obligations 26,958 25,648 22,955 21,092 18,675 31,484 30,110 27,137 24,999 30,830
Net deficit 2,686 3,207 1,844 1,982 2,072 2,996 3,740 2,051 2,183 2,905
Experience gains/(losses) on plan liabilities 102 (232) (208) (858) 135 176 (207) (200) (882) 328
Experience gains on plan assets 986 301 935 1,830 1,065 1,097 485 842 1,941 1,382
A
ctual return on pension schemes assets 1,997 1,329 1,966 2,779 2,002 2,270 1,696 2,065 3,170 2,875
A
ctual
r
eturn on pension schemes assets - % 8.9% 6.3% 10.3% 16.7% 13.5% 8.6% 6.8% 9.1% 11.4% 11.2%
*Restated