RBS 2013 Annual Report Download - page 329
Download and view the complete annual report
Please find page 329 of the 2013 RBS annual report below. You can navigate through the pages in the report by either clicking on the pages listed below, or by using the keyword search tool below to find specific information within the annual report.-
 1
1 -
2
-
3
-
4
-
5
-
6
-
7
-
8
-
9
-
10
-
11
-
12
-
13
-
14
-
15
-
16
-
17
-
18
-
19
-
20
-
21
-
22
-
23
-
24
-
25
-
26
-
27
-
28
-
29
-
30
-
31
-
32
-
33
-
34
-
35
-
36
-
37
-
38
-
39
-
40
-
41
-
42
-
43
-
44
-
45
-
46
-
47
-
48
-
49
-
50
-
51
-
52
-
53
-
54
-
55
-
56
-
57
-
58
-
59
-
60
-
61
-
62
-
63
-
64
-
65
-
66
-
67
-
68
-
69
-
70
-
71
-
72
-
73
-
74
-
75
-
76
-
77
-
78
-
79
-
80
-
81
-
82
-
83
-
84
-
85
-
86
-
87
-
88
-
89
-
90
-
91
-
92
-
93
-
94
-
95
-
96
-
97
-
98
-
99
-
100
-
101
-
102
-
103
-
104
-
105
-
106
-
107
-
108
-
109
-
110
-
111
-
112
-
113
-
114
-
115
-
116
-
117
-
118
-
119
-
120
-
121
-
122
-
123
-
124
-
125
-
126
-
127
-
128
-
129
-
130
-
131
-
132
-
133
-
134
-
135
-
136
-
137
-
138
-
139
-
140
-
141
-
142
-
143
-
144
-
145
-
146
-
147
-
148
-
149
-
150
-
151
-
152
-
153
-
154
-
155
-
156
-
157
-
158
-
159
-
160
-
161
-
162
-
163
-
164
-
165
-
166
-
167
-
168
-
169
-
170
-
171
-
172
-
173
-
174
-
175
-
176
-
177
-
178
-
179
-
180
-
181
-
182
-
183
-
184
-
185
-
186
-
187
-
188
-
189
-
190
-
191
-
192
-
193
-
194
-
195
-
196
-
197
-
198
-
199
-
200
-
201
-
202
-
203
-
204
-
205
-
206
-
207
-
208
-
209
-
210
-
211
-
212
-
213
-
214
-
215
-
216
-
217
-
218
-
219
-
220
-
221
-
222
-
223
-
224
-
225
-
226
-
227
-
228
-
229
-
230
-
231
-
232
-
233
-
234
-
235
-
236
-
237
-
238
-
239
-
240
-
241
-
242
-
243
-
244
-
245
-
246
-
247
-
248
-
249
-
250
-
251
-
252
-
253
-
254
-
255
-
256
-
257
-
258
-
259
-
260
-
261
-
262
-
263
-
264
-
265
-
266
-
267
-
268
-
269
-
270
-
271
-
272
-
273
-
274
-
275
-
276
-
277
-
278
-
279
-
280
-
281
-
282
-
283
-
284
-
285
-
286
-
287
-
288
-
289
-
290
-
291
-
292
-
293
-
294
-
295
-
296
-
297
-
298
-
299
-
300
-
301
-
302
-
303
-
304
-
305
-
306
-
307
-
308
-
309
-
310
-
311
-
312
-
313
-
314
-
315
-
316
-
317
-
318
-
 319
319 -
 320
320 -
 321
321 -
 322
322 -
 323
323 -
 324
324 -
 325
325 -
 326
326 -
 327
327 -
 328
328 -
 329
329 -
 330
330 -
 331
331 -
 332
332 -
 333
333 -
 334
334 -
 335
335 -
 336
336 -
 337
337 -
 338
338 -
 339
339 -
340
-
341
-
342
-
343
-
344
-
345
-
346
-
347
-
348
-
349
-
350
-
351
-
352
-
353
-
354
-
355
-
356
-
357
-
358
-
359
-
360
-
361
-
362
-
363
-
364
-
365
-
366
-
367
-
368
-
369
-
370
-
371
-
372
-
373
-
374
-
375
-
376
-
377
-
378
-
379
-
380
-
381
-
382
-
383
-
384
-
385
-
386
-
387
-
388
-
389
-
390
-
391
-
392
-
393
-
394
-
395
-
396
-
397
-
398
-
399
-
400
-
401
-
402
-
403
-
404
-
405
-
406
-
407
-
408
-
409
-
410
-
411
-
412
-
413
-
414
-
415
-
416
-
417
-
418
-
419
-
420
-
421
-
422
-
423
-
424
-
425
-
426
-
427
-
428
-
429
-
430
-
431
-
432
-
433
-
434
-
435
-
436
-
437
-
438
-
439
-
440
-
441
-
442
-
443
-
444
-
445
-
446
-
447
-
448
-
449
-
450
-
451
-
452
-
453
-
454
-
455
-
456
-
457
-
458
-
459
-
460
-
461
-
462
-
463
-
464
-
465
-
466
-
467
-
468
-
469
-
470
-
471
-
472
-
473
-
474
-
475
-
476
-
477
-
478
-
479
-
480
-
481
-
482
-
483
-
484
-
485
-
486
-
487
-
488
-
489
-
490
-
491
-
492
-
493
-
494
-
495
-
496
-
497
-
498
-
499
-
500
-
501
-
502
-
503
-
504
-
505
-
506
-
507
-
508
-
509
-
510
-
511
-
512
-
513
-
514
-
515
-
516
-
517
-
518
-
519
-
520
-
521
-
522
-
523
-
524
-
525
-
526
-
527
-
528
-
529
-
530
-
531
-
532
-
533
-
534
-
535
-
536
-
537
-
538
-
539
-
540
-
541
-
542
-
543
-
544
-
545
-
546
-
547
-
548
-
549
-
550
-
551
-
552
-
553
-
554
-
555
-
556
-
557
-
558
-
559
-
560
-
561
-
562
-
563
-
564
 |
 |

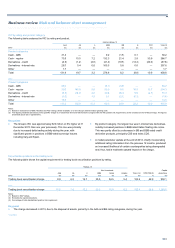
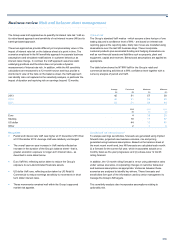
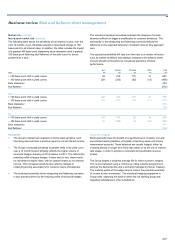
Business review Risk and balance sheet management
327
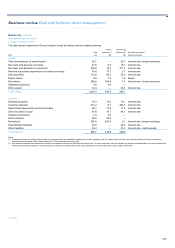
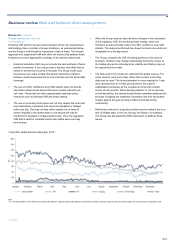
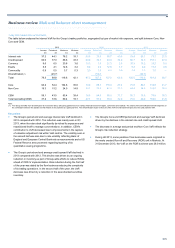
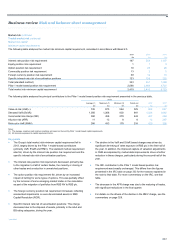
VaR back-testing*
The table below shows regulatory back-testing exceptions for a period of 250 days for 1-day 99% traded regulatory VaR vs. Clean and Hypo P&L for the
legal entities approved by the PRA and De Nederlandsche Bank.
Back-testing exceptions Model
Description Clean Hypo status
The Royal Bank of Scotland plc — — Green
National Westminster Bank Plc 1 1 Green
RBS Securities Inc — — Green
RBS Financial Products Inc — — Green
The Royal Bank of Scotland N.V. 1 1 Green
Key points
• Statistically the Group would expect to see back-testing exceptions
1% of the time over a one-year period. From a capital requirement
perspective, the PRA categorises a firm’s VaR model as green,
amber or red. A green model status is consistent with a satisfactory
VaR model and is achieved for models that have four or fewer
exceptions in a continuous 12 month period. The Group’s VaR
model has maintained a green status for its regulated legal entities
and hence has considered that no action is required to rectify or
adapt its VaR models.
• The exception at the NatWest level was mainly driven by a large
move in inflation following an Office of National Statistics
announcement in January that it would not be changing the RPI
calculation.
• The exception at the RBS NV level was primarily a result of a
significant rise in Indian bond yields as the country’s central bank
unexpectedly raised benchmark interest rates by 200 basis points.
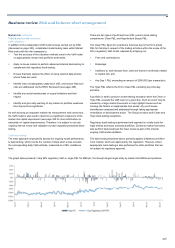
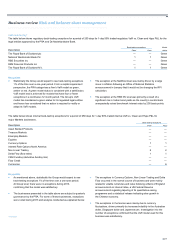
The table below shows internal back-testing exceptions for a period of 250 days for 1-day 99% traded internal VaR vs. Clean and Hypo P&L for
major Markets businesses.
Back-testing exceptions
Description Clean Hypo
A
sset Backed Products — —
Treasury Markets — —
Emerging Markets — —
Equities — —
Currency Options 1 1
Interest Rate Options North America — —
Non Linear Trading 2 2
Delta Flow (flow rates) 1 1
CEM Funding (derivative funding risk) — —
Flow Credit — —
Currencies — 6
Key points
• As mentioned above, statistically the Group would expect to see
back-testing exceptions 1% of the time over a one-year period.
At Group level, there were no exceptions during 2013,
confirming that the model was satisfactory.
• The businesses presented in the table above are subject to quarterly
governance by the PRA. For some of these businesses, exceptions
were noted during 2013 and analysis conducted as explained below.
*unaudited
• The exceptions in Currency Options, Non-Linear Trading and Delta
Flow occurred in the normal course of business and were mainly
related to volatile currencies and rates following a Bank of England
announcement on interest rates, a US Federal Reserve
announcement regarding tapering of its quantitative easing
programme and a statistical release indicating slow growth in
the Chinese economy.
• The exceptions in Currencies were mainly due to currency
fluctuations, driven primarily by increased volatility in the Australian
dollar, Singapore dollar and Japanese yen. Investigation into the
number of exceptions confirmed that the VaR model used for this
business was satisfactory.