RBS 2013 Annual Report Download - page 115
Download and view the complete annual report
Please find page 115 of the 2013 RBS annual report below. You can navigate through the pages in the report by either clicking on the pages listed below, or by using the keyword search tool below to find specific information within the annual report.-
 1
1 -
2
-
3
-
4
-
5
-
6
-
7
-
8
-
9
-
10
-
11
-
12
-
13
-
14
-
15
-
16
-
17
-
18
-
19
-
20
-
21
-
22
-
23
-
24
-
25
-
26
-
27
-
28
-
29
-
30
-
31
-
32
-
33
-
34
-
35
-
36
-
37
-
38
-
39
-
40
-
41
-
42
-
43
-
44
-
45
-
46
-
47
-
48
-
49
-
50
-
51
-
52
-
53
-
54
-
55
-
56
-
57
-
58
-
59
-
60
-
61
-
62
-
63
-
64
-
65
-
66
-
67
-
68
-
69
-
70
-
71
-
72
-
73
-
74
-
75
-
76
-
77
-
78
-
79
-
80
-
81
-
82
-
83
-
84
-
85
-
86
-
87
-
88
-
89
-
90
-
91
-
92
-
93
-
94
-
95
-
96
-
97
-
98
-
99
-
100
-
101
-
102
-
103
-
104
-
 105
105 -
 106
106 -
 107
107 -
 108
108 -
 109
109 -
 110
110 -
 111
111 -
 112
112 -
 113
113 -
 114
114 -
 115
115 -
 116
116 -
 117
117 -
 118
118 -
 119
119 -
 120
120 -
 121
121 -
 122
122 -
 123
123 -
 124
124 -
 125
125 -
126
-
127
-
128
-
129
-
130
-
131
-
132
-
133
-
134
-
135
-
136
-
137
-
138
-
139
-
140
-
141
-
142
-
143
-
144
-
145
-
146
-
147
-
148
-
149
-
150
-
151
-
152
-
153
-
154
-
155
-
156
-
157
-
158
-
159
-
160
-
161
-
162
-
163
-
164
-
165
-
166
-
167
-
168
-
169
-
170
-
171
-
172
-
173
-
174
-
175
-
176
-
177
-
178
-
179
-
180
-
181
-
182
-
183
-
184
-
185
-
186
-
187
-
188
-
189
-
190
-
191
-
192
-
193
-
194
-
195
-
196
-
197
-
198
-
199
-
200
-
201
-
202
-
203
-
204
-
205
-
206
-
207
-
208
-
209
-
210
-
211
-
212
-
213
-
214
-
215
-
216
-
217
-
218
-
219
-
220
-
221
-
222
-
223
-
224
-
225
-
226
-
227
-
228
-
229
-
230
-
231
-
232
-
233
-
234
-
235
-
236
-
237
-
238
-
239
-
240
-
241
-
242
-
243
-
244
-
245
-
246
-
247
-
248
-
249
-
250
-
251
-
252
-
253
-
254
-
255
-
256
-
257
-
258
-
259
-
260
-
261
-
262
-
263
-
264
-
265
-
266
-
267
-
268
-
269
-
270
-
271
-
272
-
273
-
274
-
275
-
276
-
277
-
278
-
279
-
280
-
281
-
282
-
283
-
284
-
285
-
286
-
287
-
288
-
289
-
290
-
291
-
292
-
293
-
294
-
295
-
296
-
297
-
298
-
299
-
300
-
301
-
302
-
303
-
304
-
305
-
306
-
307
-
308
-
309
-
310
-
311
-
312
-
313
-
314
-
315
-
316
-
317
-
318
-
319
-
320
-
321
-
322
-
323
-
324
-
325
-
326
-
327
-
328
-
329
-
330
-
331
-
332
-
333
-
334
-
335
-
336
-
337
-
338
-
339
-
340
-
341
-
342
-
343
-
344
-
345
-
346
-
347
-
348
-
349
-
350
-
351
-
352
-
353
-
354
-
355
-
356
-
357
-
358
-
359
-
360
-
361
-
362
-
363
-
364
-
365
-
366
-
367
-
368
-
369
-
370
-
371
-
372
-
373
-
374
-
375
-
376
-
377
-
378
-
379
-
380
-
381
-
382
-
383
-
384
-
385
-
386
-
387
-
388
-
389
-
390
-
391
-
392
-
393
-
394
-
395
-
396
-
397
-
398
-
399
-
400
-
401
-
402
-
403
-
404
-
405
-
406
-
407
-
408
-
409
-
410
-
411
-
412
-
413
-
414
-
415
-
416
-
417
-
418
-
419
-
420
-
421
-
422
-
423
-
424
-
425
-
426
-
427
-
428
-
429
-
430
-
431
-
432
-
433
-
434
-
435
-
436
-
437
-
438
-
439
-
440
-
441
-
442
-
443
-
444
-
445
-
446
-
447
-
448
-
449
-
450
-
451
-
452
-
453
-
454
-
455
-
456
-
457
-
458
-
459
-
460
-
461
-
462
-
463
-
464
-
465
-
466
-
467
-
468
-
469
-
470
-
471
-
472
-
473
-
474
-
475
-
476
-
477
-
478
-
479
-
480
-
481
-
482
-
483
-
484
-
485
-
486
-
487
-
488
-
489
-
490
-
491
-
492
-
493
-
494
-
495
-
496
-
497
-
498
-
499
-
500
-
501
-
502
-
503
-
504
-
505
-
506
-
507
-
508
-
509
-
510
-
511
-
512
-
513
-
514
-
515
-
516
-
517
-
518
-
519
-
520
-
521
-
522
-
523
-
524
-
525
-
526
-
527
-
528
-
529
-
530
-
531
-
532
-
533
-
534
-
535
-
536
-
537
-
538
-
539
-
540
-
541
-
542
-
543
-
544
-
545
-
546
-
547
-
548
-
549
-
550
-
551
-
552
-
553
-
554
-
555
-
556
-
557
-
558
-
559
-
560
-
561
-
562
-
563
-
564
 |
 |

Business review
113
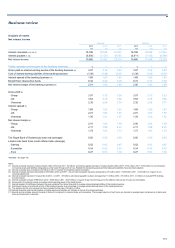
Tax
The tax charge for 2013 was £382 million (2012 - £441 million).
Loss per share
Basic loss per ordinary and equivalent B share from continuing
operations was 81.3p per share compared with 54.5p per share in 2012.
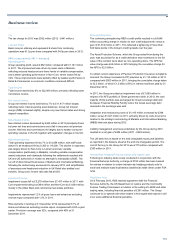
2012 compared with 2011 - managed
Operating profit
Group operating profit, was £2,952 million compared with £1,141 million
in 2011. The improvement was driven by lower costs in Markets,
reflecting reduced headcount and lower levels of variable compensation,
and a better operating performance in Non-Core, where losses fell by
32%. These improvements were partially offset by weaker performance in
Retail & Commercial, as economic conditions remained difficult.
Total income
Total income declined by 6% to £22,085 million, primarily reflecting lower
net interest income.
Net interest income
Group net interest income declined by 7% to £11,417 million largely
reflecting lower interest-earning asset balances. Group net interest
margin (NIM) increased slightly, despite very low interest rates and strong
deposit competition.
Non-interest income
Non-interest income decreased by £443 million in 2012 principally driven
by lower net fees and commissions and a fall in insurance net premium
income. Net fees and commissions fell largely due to weaker consumer
spending volumes in the UK together with legislation changes in the US.
Operating expenses
Total operating expenses fell by 7% to £13,854 million, with staff costs
down 6% as headcount fell by 8,300 to 119,200. The decline in expenses
was largely driven by Non-Core run-down and lower variable
compensation (particularly in Markets), including variable compensation
award reductions and clawbacks following the settlements reached with
UK and US authorities in relation to attempts to manipulate LIBOR. The
run-off of discontinued businesses in Markets and International Banking,
following the restructuring announced in January 2012, and simplification
of processes and headcount reduction in UK Retail also yielded cost
benefits. Group cost: income ratio was flat at 63%.
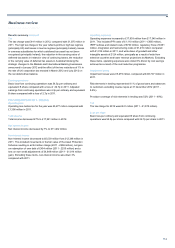
Impairment losses
Impairment losses fell to £5,279 million from £7,437 million in 2011, with
Core impairments falling by £464 million and Non-Core by £1,694 million,
mostly in the Ulster Bank and commercial real estate portfolios.
Impairments represented 1.2% of gross loans and advances excluding
reverse repos compared with 1.5% in 2011.
Risk elements in lending at 31 December 2012 represented 9.1% of
loans and advances excluding reverse repos, compared with 8.6% a year
earlier. Provision coverage was 52%, compared with 49% at 31
December 2011.
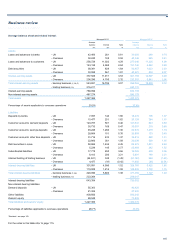
Non-operating items
The continuing strengthening RBS’s credit profile resulted in a £4,649
million accounting charge in relation to own credit adjustments versus a
gain of £1,914 million in 2011. This reflected a tightening of more than
340 basis points in the Group’s credit spreads over the year.
The Asset Protection Scheme, which the Group exited from during the
year, was accounted for as a credit derivative and movements in the fair
value of the contract were taken as non-operating items. The APS fair
value charge was £44 million in 2012 bringing the cumulative charge for
the APS to £2.5 billion.
To reflect current experience of Payment Protection Insurance complaints
received, the Group increased its PPI provision by £1,110 million in 2012
compared with £850 million in 2011, bringing the cumulative charge taken
to £2.2 billion, of which £1.3 billion (59%) in redress had been paid by 31
December 2012.
In 2011, the Group recorded an impairment loss of £1,099 million in
respect of its AFS portfolio of Greek government debt. In 2012, the vast
majority of this portfolio was exchanged for Greek sovereign debt and
European Financial Stability Facility notes; the Greek sovereign debt
received in the exchange was sold.
Integration and restructuring costs of £1,415 million increased by £394
million versus £1,021 million in 2011, primarily driven by costs incurred in
relation to the strategic restructuring of Markets and International Banking
(M&IB) that took place during 2012.
Liability management exercises undertaken by the Group during 2012
resulted in a net gain of £454 million (2011 - £255 million).
The UK bank levy is based on the total chargeable equity and liabilities
as reported in the balance sheet at the end of a chargeable period. The
cost of the levy to the Group for 2012 was £175 million compared with
£300 million in 2011.
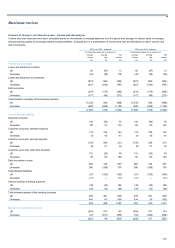
Interest Rate Hedging Products redress and related costs
Following an industry-wide review conducted in conjunction with the
Financial Services Authority, a charge of £700 million has been booked
for redress in relation to certain interest-rate hedging products sold to
small and medium-sized businesses classified as retail clients under FSA
rules.
Regulatory fines
On 6 February 2013, RBS reached agreement with the Financial
Services Authority, the US Department of Justice and the Commodity
Futures Trading Commission in relation to the setting of LIBOR and other
trading rates, including financial penalties of £381 million. The Group
continues to co-operate with other bodies in this regard and expects it will
incur some additional financial penalties.