RBS 2013 Annual Report Download - page 238
Download and view the complete annual report
Please find page 238 of the 2013 RBS annual report below. You can navigate through the pages in the report by either clicking on the pages listed below, or by using the keyword search tool below to find specific information within the annual report.-
 1
1 -
2
-
3
-
4
-
5
-
6
-
7
-
8
-
9
-
10
-
11
-
12
-
13
-
14
-
15
-
16
-
17
-
18
-
19
-
20
-
21
-
22
-
23
-
24
-
25
-
26
-
27
-
28
-
29
-
30
-
31
-
32
-
33
-
34
-
35
-
36
-
37
-
38
-
39
-
40
-
41
-
42
-
43
-
44
-
45
-
46
-
47
-
48
-
49
-
50
-
51
-
52
-
53
-
54
-
55
-
56
-
57
-
58
-
59
-
60
-
61
-
62
-
63
-
64
-
65
-
66
-
67
-
68
-
69
-
70
-
71
-
72
-
73
-
74
-
75
-
76
-
77
-
78
-
79
-
80
-
81
-
82
-
83
-
84
-
85
-
86
-
87
-
88
-
89
-
90
-
91
-
92
-
93
-
94
-
95
-
96
-
97
-
98
-
99
-
100
-
101
-
102
-
103
-
104
-
105
-
106
-
107
-
108
-
109
-
110
-
111
-
112
-
113
-
114
-
115
-
116
-
117
-
118
-
119
-
120
-
121
-
122
-
123
-
124
-
125
-
126
-
127
-
128
-
129
-
130
-
131
-
132
-
133
-
134
-
135
-
136
-
137
-
138
-
139
-
140
-
141
-
142
-
143
-
144
-
145
-
146
-
147
-
148
-
149
-
150
-
151
-
152
-
153
-
154
-
155
-
156
-
157
-
158
-
159
-
160
-
161
-
162
-
163
-
164
-
165
-
166
-
167
-
168
-
169
-
170
-
171
-
172
-
173
-
174
-
175
-
176
-
177
-
178
-
179
-
180
-
181
-
182
-
183
-
184
-
185
-
186
-
187
-
188
-
189
-
190
-
191
-
192
-
193
-
194
-
195
-
196
-
197
-
198
-
199
-
200
-
201
-
202
-
203
-
204
-
205
-
206
-
207
-
208
-
209
-
210
-
211
-
212
-
213
-
214
-
215
-
216
-
217
-
218
-
219
-
220
-
221
-
222
-
223
-
224
-
225
-
226
-
227
-
 228
228 -
 229
229 -
 230
230 -
 231
231 -
 232
232 -
 233
233 -
 234
234 -
 235
235 -
 236
236 -
 237
237 -
 238
238 -
 239
239 -
 240
240 -
 241
241 -
 242
242 -
 243
243 -
 244
244 -
 245
245 -
 246
246 -
 247
247 -
 248
248 -
249
-
250
-
251
-
252
-
253
-
254
-
255
-
256
-
257
-
258
-
259
-
260
-
261
-
262
-
263
-
264
-
265
-
266
-
267
-
268
-
269
-
270
-
271
-
272
-
273
-
274
-
275
-
276
-
277
-
278
-
279
-
280
-
281
-
282
-
283
-
284
-
285
-
286
-
287
-
288
-
289
-
290
-
291
-
292
-
293
-
294
-
295
-
296
-
297
-
298
-
299
-
300
-
301
-
302
-
303
-
304
-
305
-
306
-
307
-
308
-
309
-
310
-
311
-
312
-
313
-
314
-
315
-
316
-
317
-
318
-
319
-
320
-
321
-
322
-
323
-
324
-
325
-
326
-
327
-
328
-
329
-
330
-
331
-
332
-
333
-
334
-
335
-
336
-
337
-
338
-
339
-
340
-
341
-
342
-
343
-
344
-
345
-
346
-
347
-
348
-
349
-
350
-
351
-
352
-
353
-
354
-
355
-
356
-
357
-
358
-
359
-
360
-
361
-
362
-
363
-
364
-
365
-
366
-
367
-
368
-
369
-
370
-
371
-
372
-
373
-
374
-
375
-
376
-
377
-
378
-
379
-
380
-
381
-
382
-
383
-
384
-
385
-
386
-
387
-
388
-
389
-
390
-
391
-
392
-
393
-
394
-
395
-
396
-
397
-
398
-
399
-
400
-
401
-
402
-
403
-
404
-
405
-
406
-
407
-
408
-
409
-
410
-
411
-
412
-
413
-
414
-
415
-
416
-
417
-
418
-
419
-
420
-
421
-
422
-
423
-
424
-
425
-
426
-
427
-
428
-
429
-
430
-
431
-
432
-
433
-
434
-
435
-
436
-
437
-
438
-
439
-
440
-
441
-
442
-
443
-
444
-
445
-
446
-
447
-
448
-
449
-
450
-
451
-
452
-
453
-
454
-
455
-
456
-
457
-
458
-
459
-
460
-
461
-
462
-
463
-
464
-
465
-
466
-
467
-
468
-
469
-
470
-
471
-
472
-
473
-
474
-
475
-
476
-
477
-
478
-
479
-
480
-
481
-
482
-
483
-
484
-
485
-
486
-
487
-
488
-
489
-
490
-
491
-
492
-
493
-
494
-
495
-
496
-
497
-
498
-
499
-
500
-
501
-
502
-
503
-
504
-
505
-
506
-
507
-
508
-
509
-
510
-
511
-
512
-
513
-
514
-
515
-
516
-
517
-
518
-
519
-
520
-
521
-
522
-
523
-
524
-
525
-
526
-
527
-
528
-
529
-
530
-
531
-
532
-
533
-
534
-
535
-
536
-
537
-
538
-
539
-
540
-
541
-
542
-
543
-
544
-
545
-
546
-
547
-
548
-
549
-
550
-
551
-
552
-
553
-
554
-
555
-
556
-
557
-
558
-
559
-
560
-
561
-
562
-
563
-
564
 |
 |

Business review Risk and balance sheet management
236
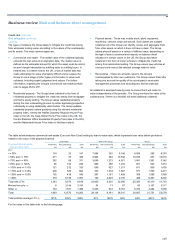
Credit risk continued
Credit risk assets* continued
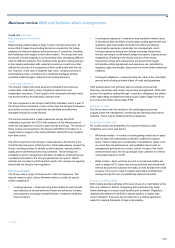
Asset quality (AQ)
Internal reporting and oversight of CRA is principally differentiated by
credit grades. Customers are assigned credit grades based on various
credit grading models that reflect the key drivers of default for each
customer type. All credit grades across the Group map to both a Group
level asset quality scale, used for external financial reporting, and a
master grading scale for wholesale exposures, used for internal
management reporting across portfolios. Accordingly, measures of risk
exposure may be readily aggregated and reported at increasing levels of
granularity depending on stakeholder or business need. Performing loans
are defined as AQ1-AQ9 (where the PD is less than 100%) and non-
performing loans as AQ10 (where the PD is 100%).
Exposures are allocated to asset quality bands on the basis of statistically
driven models, which produce an estimate of default rate. The variables
included in the models vary by product and geography. For portfolios
secured on residential property these models typically include measures
of delinquency and loan to value as well as other differentiating
characteristics such as bureau score, product features or associated
account performance information.
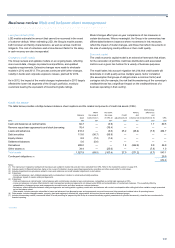
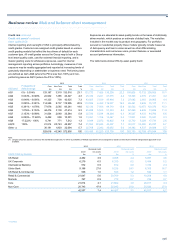
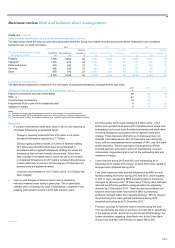
The table below shows CRA by asset quality band.
2013 2012 2011
Core Non-Core Total Total Core Non-Core Total Total Core Non-Core Total Total
A
Q band
Probability of
default range £m £m £m % £m £m £m % £m £m £m %
A
Q1 0% - 0.034% 129,197 3,319 132,516 23.1 131,772 7,428 139,200 22.2 195,826 13,732 209,558 31.1
A
Q2 0.034% - 0.048% 22,942 1,485 24,427 4.3 25,334 2,241 27,575 4.4 18,366 2,915 21,281 3.2
A
Q3 0.048% - 0.095% 41,325 700 42,025 7.3 43,925 2,039 45,964 7.3 27,082 2,883 29,965 4.4
A
Q4 0.095% - 0.381% 114,258 5,737 119,995 20.9 112,589 6,438 119,027 19.0 65,491 9,636 75,127 11.1
A
Q5 0.381% - 1.076% 77,676 2,585 80,261 14.0 92,130 7,588 99,718 15.9 92,503 10,873 103,376 15.3
A
Q6 1.076% - 2.153% 44,476 3,138 47,614 8.3 45,808 5,525 51,333 8.2 67,260 6,636 73,896 11.0
A
Q7 2.153% - 6.089% 31,504 2,060 33,564 5.9 32,720 5,544 38,264 6.1 36,567 8,133 44,700 6.6
A
Q8 6.089% - 17.222% 9,492 899 10,391 1.8 13,091 1,156 14,247 2.4 11,921 3,320 15,241 2.3
A
Q9 17.222% - 100% 6,741 771 7,512 1.3 8,849 2,073 10,922 1.8 12,710 5,024 17,734 2.6
A
Q10 100% 21,814 20,743 42,557 7.4 21,562 22,845 44,407 7.1 20,017 25,020 45,037 6.7
Other (1) 30,191 1,903 32,094 5.7 32,709 2,343 35,052 5.6 34,392 4,537 38,929 5.7
529,616 43,340 572,956 100 560,489 65,220 625,709 100 582,135 92,709 674,844 100
Note:
(1) Largely comprises assets covered by the standardised approach, for which a probability of default equivalent to those assigned to assets covered by the internal ratings based approach is not
available.
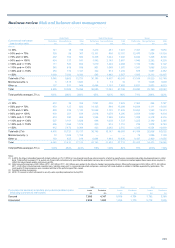
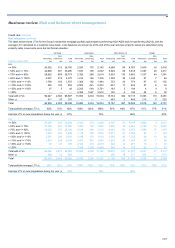
2013 2012 2011
Divisional credit Divisional credit Divisional credit
AQ10 risk assets AQ10 risk assets AQ10 risk assets
A
Q10 CRA by division £m % £m % £m %
UK Retail 4,462 3.9 4,998 4.4 5,097 4.6
UK Corporate 6,279 6.5 6,310 6.2 5,484 5.2
International Banking 572 0.9 612 0.9 1,736 2.4
Ulster Bank 9,198 27.8 8,236 24.1 6,305 16.7
US Retail & Commercial 536 1.0 633 1.2 646 1.1
Retail & Commercial 21,047 5.6 20,789 5.3 19,268 4.8
Markets 767 0.9 773 0.7 749 0.7
Core 21,814 4.1 21,562 3.8 20,017 3.4
Non-Core 20,743 47.9 22,845 35.0 25,020 27.0
42,557 7.4 44,407 7.1 45,037 6.7
*unaudited