RBS 2013 Annual Report Download - page 241
Download and view the complete annual report
Please find page 241 of the 2013 RBS annual report below. You can navigate through the pages in the report by either clicking on the pages listed below, or by using the keyword search tool below to find specific information within the annual report.-
 1
1 -
2
-
3
-
4
-
5
-
6
-
7
-
8
-
9
-
10
-
11
-
12
-
13
-
14
-
15
-
16
-
17
-
18
-
19
-
20
-
21
-
22
-
23
-
24
-
25
-
26
-
27
-
28
-
29
-
30
-
31
-
32
-
33
-
34
-
35
-
36
-
37
-
38
-
39
-
40
-
41
-
42
-
43
-
44
-
45
-
46
-
47
-
48
-
49
-
50
-
51
-
52
-
53
-
54
-
55
-
56
-
57
-
58
-
59
-
60
-
61
-
62
-
63
-
64
-
65
-
66
-
67
-
68
-
69
-
70
-
71
-
72
-
73
-
74
-
75
-
76
-
77
-
78
-
79
-
80
-
81
-
82
-
83
-
84
-
85
-
86
-
87
-
88
-
89
-
90
-
91
-
92
-
93
-
94
-
95
-
96
-
97
-
98
-
99
-
100
-
101
-
102
-
103
-
104
-
105
-
106
-
107
-
108
-
109
-
110
-
111
-
112
-
113
-
114
-
115
-
116
-
117
-
118
-
119
-
120
-
121
-
122
-
123
-
124
-
125
-
126
-
127
-
128
-
129
-
130
-
131
-
132
-
133
-
134
-
135
-
136
-
137
-
138
-
139
-
140
-
141
-
142
-
143
-
144
-
145
-
146
-
147
-
148
-
149
-
150
-
151
-
152
-
153
-
154
-
155
-
156
-
157
-
158
-
159
-
160
-
161
-
162
-
163
-
164
-
165
-
166
-
167
-
168
-
169
-
170
-
171
-
172
-
173
-
174
-
175
-
176
-
177
-
178
-
179
-
180
-
181
-
182
-
183
-
184
-
185
-
186
-
187
-
188
-
189
-
190
-
191
-
192
-
193
-
194
-
195
-
196
-
197
-
198
-
199
-
200
-
201
-
202
-
203
-
204
-
205
-
206
-
207
-
208
-
209
-
210
-
211
-
212
-
213
-
214
-
215
-
216
-
217
-
218
-
219
-
220
-
221
-
222
-
223
-
224
-
225
-
226
-
227
-
228
-
229
-
230
-
 231
231 -
 232
232 -
 233
233 -
 234
234 -
 235
235 -
 236
236 -
 237
237 -
 238
238 -
 239
239 -
 240
240 -
 241
241 -
 242
242 -
 243
243 -
 244
244 -
 245
245 -
 246
246 -
 247
247 -
 248
248 -
 249
249 -
 250
250 -
 251
251 -
252
-
253
-
254
-
255
-
256
-
257
-
258
-
259
-
260
-
261
-
262
-
263
-
264
-
265
-
266
-
267
-
268
-
269
-
270
-
271
-
272
-
273
-
274
-
275
-
276
-
277
-
278
-
279
-
280
-
281
-
282
-
283
-
284
-
285
-
286
-
287
-
288
-
289
-
290
-
291
-
292
-
293
-
294
-
295
-
296
-
297
-
298
-
299
-
300
-
301
-
302
-
303
-
304
-
305
-
306
-
307
-
308
-
309
-
310
-
311
-
312
-
313
-
314
-
315
-
316
-
317
-
318
-
319
-
320
-
321
-
322
-
323
-
324
-
325
-
326
-
327
-
328
-
329
-
330
-
331
-
332
-
333
-
334
-
335
-
336
-
337
-
338
-
339
-
340
-
341
-
342
-
343
-
344
-
345
-
346
-
347
-
348
-
349
-
350
-
351
-
352
-
353
-
354
-
355
-
356
-
357
-
358
-
359
-
360
-
361
-
362
-
363
-
364
-
365
-
366
-
367
-
368
-
369
-
370
-
371
-
372
-
373
-
374
-
375
-
376
-
377
-
378
-
379
-
380
-
381
-
382
-
383
-
384
-
385
-
386
-
387
-
388
-
389
-
390
-
391
-
392
-
393
-
394
-
395
-
396
-
397
-
398
-
399
-
400
-
401
-
402
-
403
-
404
-
405
-
406
-
407
-
408
-
409
-
410
-
411
-
412
-
413
-
414
-
415
-
416
-
417
-
418
-
419
-
420
-
421
-
422
-
423
-
424
-
425
-
426
-
427
-
428
-
429
-
430
-
431
-
432
-
433
-
434
-
435
-
436
-
437
-
438
-
439
-
440
-
441
-
442
-
443
-
444
-
445
-
446
-
447
-
448
-
449
-
450
-
451
-
452
-
453
-
454
-
455
-
456
-
457
-
458
-
459
-
460
-
461
-
462
-
463
-
464
-
465
-
466
-
467
-
468
-
469
-
470
-
471
-
472
-
473
-
474
-
475
-
476
-
477
-
478
-
479
-
480
-
481
-
482
-
483
-
484
-
485
-
486
-
487
-
488
-
489
-
490
-
491
-
492
-
493
-
494
-
495
-
496
-
497
-
498
-
499
-
500
-
501
-
502
-
503
-
504
-
505
-
506
-
507
-
508
-
509
-
510
-
511
-
512
-
513
-
514
-
515
-
516
-
517
-
518
-
519
-
520
-
521
-
522
-
523
-
524
-
525
-
526
-
527
-
528
-
529
-
530
-
531
-
532
-
533
-
534
-
535
-
536
-
537
-
538
-
539
-
540
-
541
-
542
-
543
-
544
-
545
-
546
-
547
-
548
-
549
-
550
-
551
-
552
-
553
-
554
-
555
-
556
-
557
-
558
-
559
-
560
-
561
-
562
-
563
-
564
 |
 |

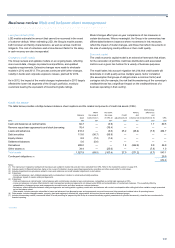
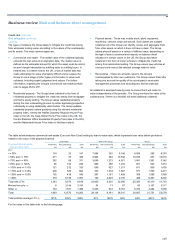
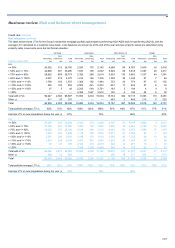
Business review Risk and balance sheet management
239
Ulster Bank Rest of the Group Group
Performing Non-performing Total Performing Non-performing Total Performing Non-performing Total
Commercial real estate
loan-to-value ratio £m £m £m £m £m £m £m £m £m
2012 (4)
<= 50% 141 18 159 7,210 281 7,491 7,351 299 7,650
> 50% and <= 70% 309 58 367 12,161 996 13,157 12,470 1,054 13,524
> 70% and <= 90% 402 164 566 6,438 1,042 7,480 6,840 1,206 8,046
> 90% and <= 100% 404 137 541 1,542 2,145 3,687 1,946 2,282 4,228
> 100% and <= 110% 111 543 654 1,019 1,449 2,468 1,130 1,992 3,122
> 110% and <= 130% 340 619 959 901 1,069 1,970 1,241 1,688 2,929
> 130% and <= 150% 353 774 1,127 322 913 1,235 675 1,687 2,362
> 150% 1,000 7,350 8,350 595 1,962 2,557 1,595 9,312 10,907
Total with LTVs 3,060 9,663 12,723 30,188 9,857 40,045 33,248 19,520 52,768
Minimal security (1) 8 1,615 1,623 3 13 16 11 1,628 1,639
Other (2) 137 811 948 6,494 1,191 7,685 6,631 2,002 8,633
Total 3,205 12,089 15,294 36,685 11,061 47,746 39,890 23,150 63,040
Total portfolio average LTV (3) 136% 286% 250% 65% 125% 80% 71% 206% 122%
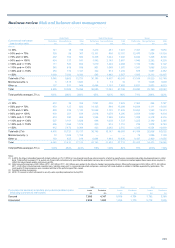
2011
<= 50% 272 32 304 7,091 332 7,423 7,363 364 7,727
> 50% and <= 70% 479 127 606 14,105 984 15,089 14,584 1,111 15,695
> 70% and <= 90% 808 332 1,140 10,042 1,191 11,233 10,850 1,523 12,373
> 90% and <= 100% 438 201 639 2,616 1,679 4,295 3,054 1,880 4,934
> 100% and <= 110% 474 390 864 1,524 1,928 3,452 1,998 2,318 4,316
> 110% and <= 130% 527 1,101 1,628 698 1,039 1,737 1,225 2,140 3,365
> 130% and <= 150% 506 1,066 1,572 239 912 1,151 745 1,978 2,723
> 150% 912 7,472 8,384 433 2,082 2,515 1,345 9,554 10,899
Total with LTVs 4,416 10,721 15,137 36,748 10,147 46,895 41,164 20,868 62,032
Minimal security (1) 72 1,086 1,158 — — — 72 1,086 1,158
Other (2) 193 625 818 8,994 1,844 10,838 9,187 2,469 11,656
Total 4,681 12,432 17,113 45,742 11,991 57,733 50,423 24,423 74,846
Total portfolio average LTV (3) 120% 264% 222% 69% 129% 82% 75% 203% 116%
Notes:
(1) In 2012, the Group reclassified loans with limited (defined as LTV>1,000%) or non-physical security as minimal security, of which a majority were commercial real estate development loans in Ulster
Bank. Total portfolio average LTV is quoted net of loans with minimal security given that the anticipated recovery rate is less than 10%. Provisions are marked against these loans where required to
reflect the relevant asset quality and recovery profile.
(2) Other non-performing loans of £2.3 billion (2012 - £2.0 billion; 2011 - £2.5 billion) were subject to the Group’s standard provisioning policies. Other performing loans of £5.4 billion (2012 - £6.6 billion;
2011 - £9.2 billion) included general corporate loans, typically unsecured, to commercial real estate companies, and major UK house builders in addition to facilities supported by guarantees. The
credit quality of these exposures was consistent with that of the performing portfolio overall.
(3) Weighted average by exposure.
(4) 2012 LTV revised to reflect refinement to security value reporting implemented during 2013.
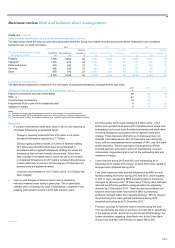
2013 2012 2011
Corporate risk elements in lending and potential problem loans Loans Provisions Loans Provisions Loans Provisions
(excluding commercial real estate) £m £m £m £m £m £m
Secured 7,686 4,347 9,936 4,704 7,782 3,369
Unsecured 2,496 1,685 1,894 1,170 2,712 1,836