RBS 2013 Annual Report Download - page 390
Download and view the complete annual report
Please find page 390 of the 2013 RBS annual report below. You can navigate through the pages in the report by either clicking on the pages listed below, or by using the keyword search tool below to find specific information within the annual report.-
 1
1 -
2
-
3
-
4
-
5
-
6
-
7
-
8
-
9
-
10
-
11
-
12
-
13
-
14
-
15
-
16
-
17
-
18
-
19
-
20
-
21
-
22
-
23
-
24
-
25
-
26
-
27
-
28
-
29
-
30
-
31
-
32
-
33
-
34
-
35
-
36
-
37
-
38
-
39
-
40
-
41
-
42
-
43
-
44
-
45
-
46
-
47
-
48
-
49
-
50
-
51
-
52
-
53
-
54
-
55
-
56
-
57
-
58
-
59
-
60
-
61
-
62
-
63
-
64
-
65
-
66
-
67
-
68
-
69
-
70
-
71
-
72
-
73
-
74
-
75
-
76
-
77
-
78
-
79
-
80
-
81
-
82
-
83
-
84
-
85
-
86
-
87
-
88
-
89
-
90
-
91
-
92
-
93
-
94
-
95
-
96
-
97
-
98
-
99
-
100
-
101
-
102
-
103
-
104
-
105
-
106
-
107
-
108
-
109
-
110
-
111
-
112
-
113
-
114
-
115
-
116
-
117
-
118
-
119
-
120
-
121
-
122
-
123
-
124
-
125
-
126
-
127
-
128
-
129
-
130
-
131
-
132
-
133
-
134
-
135
-
136
-
137
-
138
-
139
-
140
-
141
-
142
-
143
-
144
-
145
-
146
-
147
-
148
-
149
-
150
-
151
-
152
-
153
-
154
-
155
-
156
-
157
-
158
-
159
-
160
-
161
-
162
-
163
-
164
-
165
-
166
-
167
-
168
-
169
-
170
-
171
-
172
-
173
-
174
-
175
-
176
-
177
-
178
-
179
-
180
-
181
-
182
-
183
-
184
-
185
-
186
-
187
-
188
-
189
-
190
-
191
-
192
-
193
-
194
-
195
-
196
-
197
-
198
-
199
-
200
-
201
-
202
-
203
-
204
-
205
-
206
-
207
-
208
-
209
-
210
-
211
-
212
-
213
-
214
-
215
-
216
-
217
-
218
-
219
-
220
-
221
-
222
-
223
-
224
-
225
-
226
-
227
-
228
-
229
-
230
-
231
-
232
-
233
-
234
-
235
-
236
-
237
-
238
-
239
-
240
-
241
-
242
-
243
-
244
-
245
-
246
-
247
-
248
-
249
-
250
-
251
-
252
-
253
-
254
-
255
-
256
-
257
-
258
-
259
-
260
-
261
-
262
-
263
-
264
-
265
-
266
-
267
-
268
-
269
-
270
-
271
-
272
-
273
-
274
-
275
-
276
-
277
-
278
-
279
-
280
-
281
-
282
-
283
-
284
-
285
-
286
-
287
-
288
-
289
-
290
-
291
-
292
-
293
-
294
-
295
-
296
-
297
-
298
-
299
-
300
-
301
-
302
-
303
-
304
-
305
-
306
-
307
-
308
-
309
-
310
-
311
-
312
-
313
-
314
-
315
-
316
-
317
-
318
-
319
-
320
-
321
-
322
-
323
-
324
-
325
-
326
-
327
-
328
-
329
-
330
-
331
-
332
-
333
-
334
-
335
-
336
-
337
-
338
-
339
-
340
-
341
-
342
-
343
-
344
-
345
-
346
-
347
-
348
-
349
-
350
-
351
-
352
-
353
-
354
-
355
-
356
-
357
-
358
-
359
-
360
-
361
-
362
-
363
-
364
-
365
-
366
-
367
-
368
-
369
-
370
-
371
-
372
-
373
-
374
-
375
-
376
-
377
-
378
-
379
-
 380
380 -
 381
381 -
 382
382 -
 383
383 -
 384
384 -
 385
385 -
 386
386 -
 387
387 -
 388
388 -
 389
389 -
 390
390 -
 391
391 -
 392
392 -
 393
393 -
 394
394 -
 395
395 -
 396
396 -
 397
397 -
 398
398 -
 399
399 -
 400
400 -
401
-
402
-
403
-
404
-
405
-
406
-
407
-
408
-
409
-
410
-
411
-
412
-
413
-
414
-
415
-
416
-
417
-
418
-
419
-
420
-
421
-
422
-
423
-
424
-
425
-
426
-
427
-
428
-
429
-
430
-
431
-
432
-
433
-
434
-
435
-
436
-
437
-
438
-
439
-
440
-
441
-
442
-
443
-
444
-
445
-
446
-
447
-
448
-
449
-
450
-
451
-
452
-
453
-
454
-
455
-
456
-
457
-
458
-
459
-
460
-
461
-
462
-
463
-
464
-
465
-
466
-
467
-
468
-
469
-
470
-
471
-
472
-
473
-
474
-
475
-
476
-
477
-
478
-
479
-
480
-
481
-
482
-
483
-
484
-
485
-
486
-
487
-
488
-
489
-
490
-
491
-
492
-
493
-
494
-
495
-
496
-
497
-
498
-
499
-
500
-
501
-
502
-
503
-
504
-
505
-
506
-
507
-
508
-
509
-
510
-
511
-
512
-
513
-
514
-
515
-
516
-
517
-
518
-
519
-
520
-
521
-
522
-
523
-
524
-
525
-
526
-
527
-
528
-
529
-
530
-
531
-
532
-
533
-
534
-
535
-
536
-
537
-
538
-
539
-
540
-
541
-
542
-
543
-
544
-
545
-
546
-
547
-
548
-
549
-
550
-
551
-
552
-
553
-
554
-
555
-
556
-
557
-
558
-
559
-
560
-
561
-
562
-
563
-
564
 |
 |

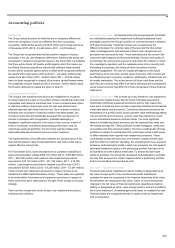
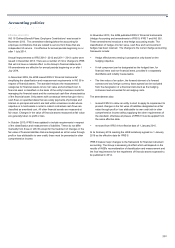
Accounting policies
388
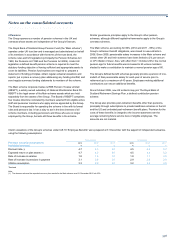
Deferred tax
The Group makes provision for deferred tax on temporary differences
where tax recognition occurs at a different time from accounting
recognition. Deferred tax assets of £3,478 million were recognised as at
31 December 2013 (2012 - £3,443 million; 2011 - £3,878 million).
The Group has recognised deferred tax assets in respect of losses,
principally in the UK, and temporary differences. Deferred tax assets are
recognised in respect of unused tax losses to the extent that it is probable
that there will be future UK taxable profits against which the losses can
be utilised. Business projections indicate that sufficient future taxable
income will be available against which to offset these recognised deferred
tax assets within eight years (2012 and 2011 - six years). Deferred tax
assets of £4,942 million (2012 - £3,827 million; 2011 - £3,246 million)
have not been recognised in respect of tax losses carried forward where
the availability of future taxable profits is uncertain. Further details about
the Group’s deferred tax assets are given in Note 23.
Loan impairment provisions
The Group's loan impairment provisions are established to recognise
incurred impairment losses in its portfolio of loans classified as loans and
receivables and carried at amortised cost. A loan is impaired when there
is objective evidence that events since the loan was granted have
affected expected cash flows from the loan. Such objective evidence,
indicative that a borrower’s financial condition has deteriorated, can
include for loans that are individually assessed: the non-payment of
interest or principal; debt renegotiation; probable bankruptcy or
liquidation; significant reduction in the value of any security; breach of
limits or covenants; and deteriorating trading performance and, for
collectively assessed portfolios: the borrowers’ payment status and
observable data about relevant macroeconomic measures.
The impairment loss is the difference between the carrying value of the
loan and the present value of estimated future cash flows at the loan's
original effective interest rate.
At 31 December 2013, loans and advances to customers classified as
loans and receivables totalled £364,772 million (2012 - £397,846 million;
2011 - £427,805 million) and customer loan impairment provisions
amounted to £25,153 million (2012 - £21,136 million; 2011 - £19,760
million). Loan impairment provisions charged to profit or loss in 2013
amounted to £8,427 million (2012 - £5,292 million; 2011 - £7,241 million).
These include loan impairment provisions in respect of loans to be
transferred to RBS Capital Resolution Group. These loans are expected
to be exited within three years and impairment provisions in respect of
these loans have been reassessed in the light of this change in recovery
strategy.
There are two components to the Group's loan impairment provisions:
individual and collective.
Individual component - all impaired loans that exceed specific thresholds
are individually assessed for impairment. Individually assessed loans
principally comprise the Group's portfolio of commercial loans to medium
and large businesses. Impairment losses are recognised as the
difference between the carrying value of the loan and the discounted
value of management's best estimate of future cash repayments and
proceeds from any security held. These estimates take into account the
customer's debt capacity and financial flexibility; the level and quality of
its earnings; the amount and sources of cash flows; the industry in which
the counterparty operates; and the realisable value of any security held.
Estimating the quantum and timing of future recoveries involves
significant judgement. The size of receipts will depend on the future
performance of the borrower and the value of security, both of which will
be affected by future economic conditions; additionally, collateral may not
be readily marketable. The actual amount of future cash flows and the
date they are received may differ from these estimates and consequently
actual losses incurred may differ from those recognised in these financial
statements.
Collective component - this is made up of two elements: loan impairment
provisions for impaired loans that are below individual assessment
thresholds (collectively assessed provisions) and for loan losses that
have been incurred but have not been separately identified at the balance
sheet date (latent loss provisions). Collectively assessed provisions are
established on a portfolio basis using a present value methodology taking
into account the level of arrears, security, past loss experience, credit
scores and defaults based on portfolio trends. The most significant
factors in establishing these provisions are the expected loss rates and
the related average life. These portfolios include mortgages, credit card
receivables and other personal lending. The future credit quality of these
portfolios is subject to uncertainties that could cause actual credit losses
to differ materially from reported loan impairment provisions. These
uncertainties include the economic environment, notably interest rates
and their effect on customer spending, the unemployment level, payment
behaviour and bankruptcy trends. Latent loss provisions are held against
estimated impairment losses in the performing portfolio that have yet to
be identified as at the balance sheet date. To assess the latent loss
within its portfolios, the Group has developed methodologies to estimate
the time that an asset can remain impaired within a performing portfolio
before it is identified and reported as such.
Fair value - financial instruments
Financial instruments classified as held-for-trading or designated as at
fair value through profit or loss and financial assets classified as
available-for-sale are recognised in the financial statements at fair value.
All derivatives are measured at fair value. Gains or losses arising from
changes in the fair value of financial instruments classified as held-for-
trading or designated as at fair value through profit or loss are included in
the income statement. Unrealised gains and losses on available-for-sale
financial assets are recognised directly in equity unless an impairment
loss is recognised.