RBS 2013 Annual Report Download - page 442
Download and view the complete annual report
Please find page 442 of the 2013 RBS annual report below. You can navigate through the pages in the report by either clicking on the pages listed below, or by using the keyword search tool below to find specific information within the annual report.-
 1
1 -
2
-
3
-
4
-
5
-
6
-
7
-
8
-
9
-
10
-
11
-
12
-
13
-
14
-
15
-
16
-
17
-
18
-
19
-
20
-
21
-
22
-
23
-
24
-
25
-
26
-
27
-
28
-
29
-
30
-
31
-
32
-
33
-
34
-
35
-
36
-
37
-
38
-
39
-
40
-
41
-
42
-
43
-
44
-
45
-
46
-
47
-
48
-
49
-
50
-
51
-
52
-
53
-
54
-
55
-
56
-
57
-
58
-
59
-
60
-
61
-
62
-
63
-
64
-
65
-
66
-
67
-
68
-
69
-
70
-
71
-
72
-
73
-
74
-
75
-
76
-
77
-
78
-
79
-
80
-
81
-
82
-
83
-
84
-
85
-
86
-
87
-
88
-
89
-
90
-
91
-
92
-
93
-
94
-
95
-
96
-
97
-
98
-
99
-
100
-
101
-
102
-
103
-
104
-
105
-
106
-
107
-
108
-
109
-
110
-
111
-
112
-
113
-
114
-
115
-
116
-
117
-
118
-
119
-
120
-
121
-
122
-
123
-
124
-
125
-
126
-
127
-
128
-
129
-
130
-
131
-
132
-
133
-
134
-
135
-
136
-
137
-
138
-
139
-
140
-
141
-
142
-
143
-
144
-
145
-
146
-
147
-
148
-
149
-
150
-
151
-
152
-
153
-
154
-
155
-
156
-
157
-
158
-
159
-
160
-
161
-
162
-
163
-
164
-
165
-
166
-
167
-
168
-
169
-
170
-
171
-
172
-
173
-
174
-
175
-
176
-
177
-
178
-
179
-
180
-
181
-
182
-
183
-
184
-
185
-
186
-
187
-
188
-
189
-
190
-
191
-
192
-
193
-
194
-
195
-
196
-
197
-
198
-
199
-
200
-
201
-
202
-
203
-
204
-
205
-
206
-
207
-
208
-
209
-
210
-
211
-
212
-
213
-
214
-
215
-
216
-
217
-
218
-
219
-
220
-
221
-
222
-
223
-
224
-
225
-
226
-
227
-
228
-
229
-
230
-
231
-
232
-
233
-
234
-
235
-
236
-
237
-
238
-
239
-
240
-
241
-
242
-
243
-
244
-
245
-
246
-
247
-
248
-
249
-
250
-
251
-
252
-
253
-
254
-
255
-
256
-
257
-
258
-
259
-
260
-
261
-
262
-
263
-
264
-
265
-
266
-
267
-
268
-
269
-
270
-
271
-
272
-
273
-
274
-
275
-
276
-
277
-
278
-
279
-
280
-
281
-
282
-
283
-
284
-
285
-
286
-
287
-
288
-
289
-
290
-
291
-
292
-
293
-
294
-
295
-
296
-
297
-
298
-
299
-
300
-
301
-
302
-
303
-
304
-
305
-
306
-
307
-
308
-
309
-
310
-
311
-
312
-
313
-
314
-
315
-
316
-
317
-
318
-
319
-
320
-
321
-
322
-
323
-
324
-
325
-
326
-
327
-
328
-
329
-
330
-
331
-
332
-
333
-
334
-
335
-
336
-
337
-
338
-
339
-
340
-
341
-
342
-
343
-
344
-
345
-
346
-
347
-
348
-
349
-
350
-
351
-
352
-
353
-
354
-
355
-
356
-
357
-
358
-
359
-
360
-
361
-
362
-
363
-
364
-
365
-
366
-
367
-
368
-
369
-
370
-
371
-
372
-
373
-
374
-
375
-
376
-
377
-
378
-
379
-
380
-
381
-
382
-
383
-
384
-
385
-
386
-
387
-
388
-
389
-
390
-
391
-
392
-
393
-
394
-
395
-
396
-
397
-
398
-
399
-
400
-
401
-
402
-
403
-
404
-
405
-
406
-
407
-
408
-
409
-
410
-
411
-
412
-
413
-
414
-
415
-
416
-
417
-
418
-
419
-
420
-
421
-
422
-
423
-
424
-
425
-
426
-
427
-
428
-
429
-
430
-
431
-
 432
432 -
 433
433 -
 434
434 -
 435
435 -
 436
436 -
 437
437 -
 438
438 -
 439
439 -
 440
440 -
 441
441 -
 442
442 -
 443
443 -
 444
444 -
 445
445 -
 446
446 -
 447
447 -
 448
448 -
 449
449 -
 450
450 -
 451
451 -
 452
452 -
453
-
454
-
455
-
456
-
457
-
458
-
459
-
460
-
461
-
462
-
463
-
464
-
465
-
466
-
467
-
468
-
469
-
470
-
471
-
472
-
473
-
474
-
475
-
476
-
477
-
478
-
479
-
480
-
481
-
482
-
483
-
484
-
485
-
486
-
487
-
488
-
489
-
490
-
491
-
492
-
493
-
494
-
495
-
496
-
497
-
498
-
499
-
500
-
501
-
502
-
503
-
504
-
505
-
506
-
507
-
508
-
509
-
510
-
511
-
512
-
513
-
514
-
515
-
516
-
517
-
518
-
519
-
520
-
521
-
522
-
523
-
524
-
525
-
526
-
527
-
528
-
529
-
530
-
531
-
532
-
533
-
534
-
535
-
536
-
537
-
538
-
539
-
540
-
541
-
542
-
543
-
544
-
545
-
546
-
547
-
548
-
549
-
550
-
551
-
552
-
553
-
554
-
555
-
556
-
557
-
558
-
559
-
560
-
561
-
562
-
563
-
564
 |
 |

Notes on the consolidated accounts
440
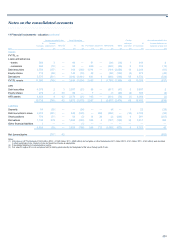
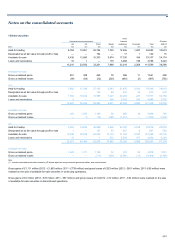
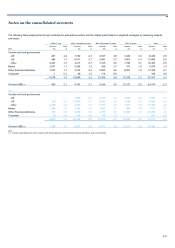
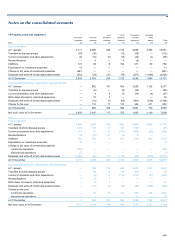
15 Debt securities
Other
Central and local government financial Of which
UK US Other Banks institutions Corporate Total ABS (1)
2013 £m £m £m £m £m £m £m £m
Held-for-trading 6,764 10,951 22,794 1,720 12,406 1,947 56,582 10,674
Designated as at fair value through profit or loss — — 104 — 17 1 122 15
A
vailable-for-sale 6,436 12,880 10,303 5,974 17,330 184 53,107 24,174
Loans and receivables 10 1 — 175 3,466 136 3,788 3,423
13,210 23,832 33,201 7,869 33,219 2,268 113,599 38,286
A
vailable-for-sale
Gross unrealised gains 201 428 445 70 386 11 1,541 458
Gross unrealised losses (69) (86) (32) (205) (493) (2) (887) (753)
2012
Held-for-trading 7,692 17,349 27,165 2,243 21,876 2,015 78,340 18,619
Designated as at fair value through profit or loss — — 123 86 610 54 873 516
A
vailable-for-sale 7,950 19,040 15,995 7,227 23,294 231 73,737 30,184
Loans and receivables 5 — — 365 3,728 390 4,488 3,707
15,647 36,389 43,283 9,921 49,508 2,690 157,438 53,026
A
vailable-for-sale
Gross unrealised gains 944 1,092 1,185 56 650 19 3,946 748
Gross unrealised losses — (1) (14) (498) (1,319) — (1,832) (1,816)
2011
Held-for-trading 9,004 19,636 36,928 3,400 23,160 2,948 95,076 20,816
Designated as at fair value through profit or loss 1 — 127 53 457 9 647 558
A
vailable-for-sale 13,436 20,848 25,552 13,175 31,752 2,535 107,298 40,735
Loans and receivables 10 — 1 312 5,259 477 6,059 5,200
22,451 40,484 62,608 16,940 60,628 5,969 209,080 67,309
A
vailable-for-sale
Gross unrealised gains 1,428 1,311 1,180 52 913 94 4,978 1,001
Gross unrealised losses — — (171) (838) (2,386) (13) (3,408) (3,158)
Note:
(1) Includes asset-backed securities issued by US federal agencies and government sponsored entities, and covered bonds.
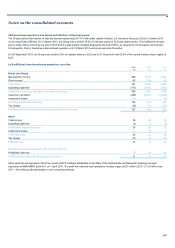
Gross gains of £1,111 million (2012 - £1,883 million; 2011 - £739 million) and gross losses of £353 million (2012 - £901 million; 2011- £60 million) were
realised on the sale of available-for-sale securities in continuing operations.
Gross gains of £3 million (2012 - £78 million; 2011 - £87 million) and gross losses of nil (2012 - £12 million; 2011 - £34 million) were realised on the sale
of available-for-sale securities in discontinued operations.