RBS 2013 Annual Report Download - page 473
Download and view the complete annual report
Please find page 473 of the 2013 RBS annual report below. You can navigate through the pages in the report by either clicking on the pages listed below, or by using the keyword search tool below to find specific information within the annual report.-
 1
1 -
2
-
3
-
4
-
5
-
6
-
7
-
8
-
9
-
10
-
11
-
12
-
13
-
14
-
15
-
16
-
17
-
18
-
19
-
20
-
21
-
22
-
23
-
24
-
25
-
26
-
27
-
28
-
29
-
30
-
31
-
32
-
33
-
34
-
35
-
36
-
37
-
38
-
39
-
40
-
41
-
42
-
43
-
44
-
45
-
46
-
47
-
48
-
49
-
50
-
51
-
52
-
53
-
54
-
55
-
56
-
57
-
58
-
59
-
60
-
61
-
62
-
63
-
64
-
65
-
66
-
67
-
68
-
69
-
70
-
71
-
72
-
73
-
74
-
75
-
76
-
77
-
78
-
79
-
80
-
81
-
82
-
83
-
84
-
85
-
86
-
87
-
88
-
89
-
90
-
91
-
92
-
93
-
94
-
95
-
96
-
97
-
98
-
99
-
100
-
101
-
102
-
103
-
104
-
105
-
106
-
107
-
108
-
109
-
110
-
111
-
112
-
113
-
114
-
115
-
116
-
117
-
118
-
119
-
120
-
121
-
122
-
123
-
124
-
125
-
126
-
127
-
128
-
129
-
130
-
131
-
132
-
133
-
134
-
135
-
136
-
137
-
138
-
139
-
140
-
141
-
142
-
143
-
144
-
145
-
146
-
147
-
148
-
149
-
150
-
151
-
152
-
153
-
154
-
155
-
156
-
157
-
158
-
159
-
160
-
161
-
162
-
163
-
164
-
165
-
166
-
167
-
168
-
169
-
170
-
171
-
172
-
173
-
174
-
175
-
176
-
177
-
178
-
179
-
180
-
181
-
182
-
183
-
184
-
185
-
186
-
187
-
188
-
189
-
190
-
191
-
192
-
193
-
194
-
195
-
196
-
197
-
198
-
199
-
200
-
201
-
202
-
203
-
204
-
205
-
206
-
207
-
208
-
209
-
210
-
211
-
212
-
213
-
214
-
215
-
216
-
217
-
218
-
219
-
220
-
221
-
222
-
223
-
224
-
225
-
226
-
227
-
228
-
229
-
230
-
231
-
232
-
233
-
234
-
235
-
236
-
237
-
238
-
239
-
240
-
241
-
242
-
243
-
244
-
245
-
246
-
247
-
248
-
249
-
250
-
251
-
252
-
253
-
254
-
255
-
256
-
257
-
258
-
259
-
260
-
261
-
262
-
263
-
264
-
265
-
266
-
267
-
268
-
269
-
270
-
271
-
272
-
273
-
274
-
275
-
276
-
277
-
278
-
279
-
280
-
281
-
282
-
283
-
284
-
285
-
286
-
287
-
288
-
289
-
290
-
291
-
292
-
293
-
294
-
295
-
296
-
297
-
298
-
299
-
300
-
301
-
302
-
303
-
304
-
305
-
306
-
307
-
308
-
309
-
310
-
311
-
312
-
313
-
314
-
315
-
316
-
317
-
318
-
319
-
320
-
321
-
322
-
323
-
324
-
325
-
326
-
327
-
328
-
329
-
330
-
331
-
332
-
333
-
334
-
335
-
336
-
337
-
338
-
339
-
340
-
341
-
342
-
343
-
344
-
345
-
346
-
347
-
348
-
349
-
350
-
351
-
352
-
353
-
354
-
355
-
356
-
357
-
358
-
359
-
360
-
361
-
362
-
363
-
364
-
365
-
366
-
367
-
368
-
369
-
370
-
371
-
372
-
373
-
374
-
375
-
376
-
377
-
378
-
379
-
380
-
381
-
382
-
383
-
384
-
385
-
386
-
387
-
388
-
389
-
390
-
391
-
392
-
393
-
394
-
395
-
396
-
397
-
398
-
399
-
400
-
401
-
402
-
403
-
404
-
405
-
406
-
407
-
408
-
409
-
410
-
411
-
412
-
413
-
414
-
415
-
416
-
417
-
418
-
419
-
420
-
421
-
422
-
423
-
424
-
425
-
426
-
427
-
428
-
429
-
430
-
431
-
432
-
433
-
434
-
435
-
436
-
437
-
438
-
439
-
440
-
441
-
442
-
443
-
444
-
445
-
446
-
447
-
448
-
449
-
450
-
451
-
452
-
453
-
454
-
455
-
456
-
457
-
458
-
459
-
460
-
461
-
462
-
 463
463 -
 464
464 -
 465
465 -
 466
466 -
 467
467 -
 468
468 -
 469
469 -
 470
470 -
 471
471 -
 472
472 -
 473
473 -
 474
474 -
 475
475 -
 476
476 -
 477
477 -
 478
478 -
 479
479 -
 480
480 -
 481
481 -
 482
482 -
 483
483 -
484
-
485
-
486
-
487
-
488
-
489
-
490
-
491
-
492
-
493
-
494
-
495
-
496
-
497
-
498
-
499
-
500
-
501
-
502
-
503
-
504
-
505
-
506
-
507
-
508
-
509
-
510
-
511
-
512
-
513
-
514
-
515
-
516
-
517
-
518
-
519
-
520
-
521
-
522
-
523
-
524
-
525
-
526
-
527
-
528
-
529
-
530
-
531
-
532
-
533
-
534
-
535
-
536
-
537
-
538
-
539
-
540
-
541
-
542
-
543
-
544
-
545
-
546
-
547
-
548
-
549
-
550
-
551
-
552
-
553
-
554
-
555
-
556
-
557
-
558
-
559
-
560
-
561
-
562
-
563
-
564
 |
 |

Notes on the consolidated accounts
471
2013 2012 2011
£m £m £m
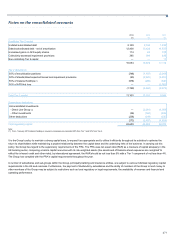
Qualifying Tier 2 capital
Undated subordinated debt 2,109 2,194 1,838
Dated subordinated debt - net of amortisation 12,436 13,420 14,527
Unrealised gains on AFS equity shares 114 63 108
Collectively assessed impairment provisions 395 399 635
Non-controlling Tier 2 capital — — 11
15,054 16,076 17,119
Tier 2 deductions
50% of securitisation positions (748) (1,107) (2,019)
50% of standardised expected losses less impairment provisions (25) (2,522) (3,451)
50% of material holdings (1) (976) (295) (340)
50% of APS first loss — — (2,763)
(1,749) (3,924) (8,573)
Total Tier 2 capital 13,305 12,152 8,546
Supervisory deductions
Unconsolidated investments
- Direct Line Group (1) — (2,081) (4,354)
- Other investments (36) (162) (239)
Other deductions (236) (244) (235)
(272) (2,487) (4,828)
Total regulatory capital 63,659 66,800 60,708
Note:
(1) From 1 January 2013 material holdings in insurance companies are deducted 50% from Tier 1 and 50% from Tier 2.
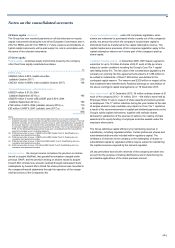
It is the Group's policy to maintain a strong capital base, to expand it as appropriate and to utilise it efficiently throughout its activities to optimise the
return to shareholders while maintaining a prudent relationship between the capital base and the underlying risks of the business. In carrying out this
policy, the Group has regard to the supervisory requirements of the PRA. The PRA uses risk asset ratio (RAR) as a measure of capital adequacy in the
UK banking sector, comparing a bank's capital resources with its risk-weighted assets (the assets and off-balance sheet exposures are ‘weighted’ to
reflect the inherent credit and other risks); by international agreement, the RAR should be not less than 8% with a Tier 1 component of not less than 4%.
The Group has complied with the PRA’s capital requirements throughout the year.
A number of subsidiaries and sub-groups within the Group, principally banking and insurance entities, are subject to various individual regulatory capital
requirements in the UK and overseas. Furthermore, the payment of dividends by subsidiaries and the ability of members of the Group to lend money to
other members of the Group may be subject to restrictions such as local regulatory or legal requirements, the availability of reserves and financial and
operating performance.