RBS 2013 Annual Report Download - page 135
Download and view the complete annual report
Please find page 135 of the 2013 RBS annual report below. You can navigate through the pages in the report by either clicking on the pages listed below, or by using the keyword search tool below to find specific information within the annual report.-
 1
1 -
2
-
3
-
4
-
5
-
6
-
7
-
8
-
9
-
10
-
11
-
12
-
13
-
14
-
15
-
16
-
17
-
18
-
19
-
20
-
21
-
22
-
23
-
24
-
25
-
26
-
27
-
28
-
29
-
30
-
31
-
32
-
33
-
34
-
35
-
36
-
37
-
38
-
39
-
40
-
41
-
42
-
43
-
44
-
45
-
46
-
47
-
48
-
49
-
50
-
51
-
52
-
53
-
54
-
55
-
56
-
57
-
58
-
59
-
60
-
61
-
62
-
63
-
64
-
65
-
66
-
67
-
68
-
69
-
70
-
71
-
72
-
73
-
74
-
75
-
76
-
77
-
78
-
79
-
80
-
81
-
82
-
83
-
84
-
85
-
86
-
87
-
88
-
89
-
90
-
91
-
92
-
93
-
94
-
95
-
96
-
97
-
98
-
99
-
100
-
101
-
102
-
103
-
104
-
105
-
106
-
107
-
108
-
109
-
110
-
111
-
112
-
113
-
114
-
115
-
116
-
117
-
118
-
119
-
120
-
121
-
122
-
123
-
124
-
 125
125 -
 126
126 -
 127
127 -
 128
128 -
 129
129 -
 130
130 -
 131
131 -
 132
132 -
 133
133 -
 134
134 -
 135
135 -
 136
136 -
 137
137 -
 138
138 -
 139
139 -
 140
140 -
 141
141 -
 142
142 -
 143
143 -
 144
144 -
 145
145 -
146
-
147
-
148
-
149
-
150
-
151
-
152
-
153
-
154
-
155
-
156
-
157
-
158
-
159
-
160
-
161
-
162
-
163
-
164
-
165
-
166
-
167
-
168
-
169
-
170
-
171
-
172
-
173
-
174
-
175
-
176
-
177
-
178
-
179
-
180
-
181
-
182
-
183
-
184
-
185
-
186
-
187
-
188
-
189
-
190
-
191
-
192
-
193
-
194
-
195
-
196
-
197
-
198
-
199
-
200
-
201
-
202
-
203
-
204
-
205
-
206
-
207
-
208
-
209
-
210
-
211
-
212
-
213
-
214
-
215
-
216
-
217
-
218
-
219
-
220
-
221
-
222
-
223
-
224
-
225
-
226
-
227
-
228
-
229
-
230
-
231
-
232
-
233
-
234
-
235
-
236
-
237
-
238
-
239
-
240
-
241
-
242
-
243
-
244
-
245
-
246
-
247
-
248
-
249
-
250
-
251
-
252
-
253
-
254
-
255
-
256
-
257
-
258
-
259
-
260
-
261
-
262
-
263
-
264
-
265
-
266
-
267
-
268
-
269
-
270
-
271
-
272
-
273
-
274
-
275
-
276
-
277
-
278
-
279
-
280
-
281
-
282
-
283
-
284
-
285
-
286
-
287
-
288
-
289
-
290
-
291
-
292
-
293
-
294
-
295
-
296
-
297
-
298
-
299
-
300
-
301
-
302
-
303
-
304
-
305
-
306
-
307
-
308
-
309
-
310
-
311
-
312
-
313
-
314
-
315
-
316
-
317
-
318
-
319
-
320
-
321
-
322
-
323
-
324
-
325
-
326
-
327
-
328
-
329
-
330
-
331
-
332
-
333
-
334
-
335
-
336
-
337
-
338
-
339
-
340
-
341
-
342
-
343
-
344
-
345
-
346
-
347
-
348
-
349
-
350
-
351
-
352
-
353
-
354
-
355
-
356
-
357
-
358
-
359
-
360
-
361
-
362
-
363
-
364
-
365
-
366
-
367
-
368
-
369
-
370
-
371
-
372
-
373
-
374
-
375
-
376
-
377
-
378
-
379
-
380
-
381
-
382
-
383
-
384
-
385
-
386
-
387
-
388
-
389
-
390
-
391
-
392
-
393
-
394
-
395
-
396
-
397
-
398
-
399
-
400
-
401
-
402
-
403
-
404
-
405
-
406
-
407
-
408
-
409
-
410
-
411
-
412
-
413
-
414
-
415
-
416
-
417
-
418
-
419
-
420
-
421
-
422
-
423
-
424
-
425
-
426
-
427
-
428
-
429
-
430
-
431
-
432
-
433
-
434
-
435
-
436
-
437
-
438
-
439
-
440
-
441
-
442
-
443
-
444
-
445
-
446
-
447
-
448
-
449
-
450
-
451
-
452
-
453
-
454
-
455
-
456
-
457
-
458
-
459
-
460
-
461
-
462
-
463
-
464
-
465
-
466
-
467
-
468
-
469
-
470
-
471
-
472
-
473
-
474
-
475
-
476
-
477
-
478
-
479
-
480
-
481
-
482
-
483
-
484
-
485
-
486
-
487
-
488
-
489
-
490
-
491
-
492
-
493
-
494
-
495
-
496
-
497
-
498
-
499
-
500
-
501
-
502
-
503
-
504
-
505
-
506
-
507
-
508
-
509
-
510
-
511
-
512
-
513
-
514
-
515
-
516
-
517
-
518
-
519
-
520
-
521
-
522
-
523
-
524
-
525
-
526
-
527
-
528
-
529
-
530
-
531
-
532
-
533
-
534
-
535
-
536
-
537
-
538
-
539
-
540
-
541
-
542
-
543
-
544
-
545
-
546
-
547
-
548
-
549
-
550
-
551
-
552
-
553
-
554
-
555
-
556
-
557
-
558
-
559
-
560
-
561
-
562
-
563
-
564
 |
 |

Business review
133
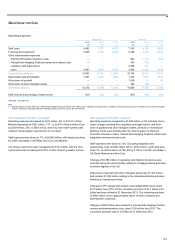
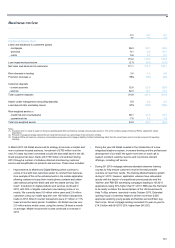
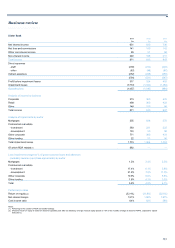
2013 2012 2011
£bn £bn £bn
Capital and balance sheet
Loans and advances to customers (gross)
- mortgages 99.3 99.1 95.0
- personal 8.1 8.8 10.1
- cards 5.8 5.7 5.7
113.2 113.6 110.8
Loan impairment provisions (2.1) (2.6) (2.7)
Net loans and advances to customers 111.1 111.0 108.1
Risk elements in lending 3.6 4.6 4.6
Provision coverage (2) 59% 58% 58%
Customer deposits
- current accounts 32.6 28.9 26.8
- savings 82.3 78.7 75.1
Total customer deposits 114.9 107.6 101.9
A
ssets under management (excluding deposits) 5.8 6.0 5.5
Loan:deposit ratio (excluding repos) 97% 103% 106%
Risk-weighted assets (3)
- credit risk (non-counterparty) 36.1 37.9 41.1
- operational risk 7.8 7.8 7.3
Total risk-weighted assets 43.9 45.7 48.4
Notes:
(1) Divisional return on equity is based on divisional operating profit after tax divided by average notional equity (based on 10% of the monthly average of divisional RWAs, adjusted for capital
deductions).
(2) Provision coverage percentage represents loan impairment provisions as a percentage of risk elements in lending.
(3) Divisional RWAs are based on a long-term conservative average secured mortgage probability of default methodology rather than the current lower point in time basis required for regulatory
reporting.
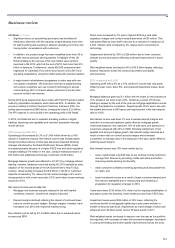
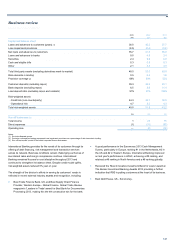
In March 2013 UK Retail announced its strategy to become a simpler and
more customer-focused business. Investment of £700 million over the
next 3-5 years has been committed to build the best retail bank in the UK.
Good progress has been made with £180 million of investment during
2013 through a number of initiatives directed at enhancing customer
service and simplification of products and services. These have included:
• Improvements to Mobile and Digital Banking which continue to
evolve in line with how customers prefer to conduct their business.
One example of this is the enhancements in the mobile application
allowing customers to pay their mobile phone contacts and obtain
cash without using their debit card with the award winning ‘Get
Cash’. Investment in digital products and services continued in
2013, with 50% of eligible customers now banking online or on
mobile. We currently have 5.6 million online users and 2.9 million
customers using our mobile app with over 100 million transactions
made in 2013. Branch counter transactions were 31 million or 11%
lower across the same period. In addition, UK Retail now has over
2.5 million active mobile users, using the service 28 times a month
on average. Mobile net promoter scores continued to increase in
2013.
• During the year UK Retail invested in the introduction of a new
integrated telephony system, increased training and the professional
development of our staff. We spent more time on each call to
support excellent customer service and to promote relevant
offerings, including self service.
• During Q1 2013 mortgage advisors attended extensive training
courses to help ensure customers receive the best possible
outcome to meet their needs. The training affected balance growth
during H1 2013; however, application volumes have rebounded
quickly with the launch of competitively priced products and the
‘NatYes’ and ‘RBYES’ advertising campaigns leading to H2 2013
applications being 30% higher than H1 2013. RBS was the first bank
to be ready to deliver the second phase of the UK Government’s
Help To Buy scheme, launched in early October 2013. Extended
opening hours in branches helped to deliver more than 3,000
approvals assisting young people and families across Britain buy
their home. Gross mortgage lending increased 3% year-on-year to
£14.3 billion with Q4 2013 25% higher than Q4 2012.