RBS 2013 Annual Report Download - page 294
Download and view the complete annual report
Please find page 294 of the 2013 RBS annual report below. You can navigate through the pages in the report by either clicking on the pages listed below, or by using the keyword search tool below to find specific information within the annual report.-
 1
1 -
2
-
3
-
4
-
5
-
6
-
7
-
8
-
9
-
10
-
11
-
12
-
13
-
14
-
15
-
16
-
17
-
18
-
19
-
20
-
21
-
22
-
23
-
24
-
25
-
26
-
27
-
28
-
29
-
30
-
31
-
32
-
33
-
34
-
35
-
36
-
37
-
38
-
39
-
40
-
41
-
42
-
43
-
44
-
45
-
46
-
47
-
48
-
49
-
50
-
51
-
52
-
53
-
54
-
55
-
56
-
57
-
58
-
59
-
60
-
61
-
62
-
63
-
64
-
65
-
66
-
67
-
68
-
69
-
70
-
71
-
72
-
73
-
74
-
75
-
76
-
77
-
78
-
79
-
80
-
81
-
82
-
83
-
84
-
85
-
86
-
87
-
88
-
89
-
90
-
91
-
92
-
93
-
94
-
95
-
96
-
97
-
98
-
99
-
100
-
101
-
102
-
103
-
104
-
105
-
106
-
107
-
108
-
109
-
110
-
111
-
112
-
113
-
114
-
115
-
116
-
117
-
118
-
119
-
120
-
121
-
122
-
123
-
124
-
125
-
126
-
127
-
128
-
129
-
130
-
131
-
132
-
133
-
134
-
135
-
136
-
137
-
138
-
139
-
140
-
141
-
142
-
143
-
144
-
145
-
146
-
147
-
148
-
149
-
150
-
151
-
152
-
153
-
154
-
155
-
156
-
157
-
158
-
159
-
160
-
161
-
162
-
163
-
164
-
165
-
166
-
167
-
168
-
169
-
170
-
171
-
172
-
173
-
174
-
175
-
176
-
177
-
178
-
179
-
180
-
181
-
182
-
183
-
184
-
185
-
186
-
187
-
188
-
189
-
190
-
191
-
192
-
193
-
194
-
195
-
196
-
197
-
198
-
199
-
200
-
201
-
202
-
203
-
204
-
205
-
206
-
207
-
208
-
209
-
210
-
211
-
212
-
213
-
214
-
215
-
216
-
217
-
218
-
219
-
220
-
221
-
222
-
223
-
224
-
225
-
226
-
227
-
228
-
229
-
230
-
231
-
232
-
233
-
234
-
235
-
236
-
237
-
238
-
239
-
240
-
241
-
242
-
243
-
244
-
245
-
246
-
247
-
248
-
249
-
250
-
251
-
252
-
253
-
254
-
255
-
256
-
257
-
258
-
259
-
260
-
261
-
262
-
263
-
264
-
265
-
266
-
267
-
268
-
269
-
270
-
271
-
272
-
273
-
274
-
275
-
276
-
277
-
278
-
279
-
280
-
281
-
282
-
283
-
 284
284 -
 285
285 -
 286
286 -
 287
287 -
 288
288 -
 289
289 -
 290
290 -
 291
291 -
 292
292 -
 293
293 -
 294
294 -
 295
295 -
 296
296 -
 297
297 -
 298
298 -
 299
299 -
 300
300 -
 301
301 -
 302
302 -
 303
303 -
 304
304 -
305
-
306
-
307
-
308
-
309
-
310
-
311
-
312
-
313
-
314
-
315
-
316
-
317
-
318
-
319
-
320
-
321
-
322
-
323
-
324
-
325
-
326
-
327
-
328
-
329
-
330
-
331
-
332
-
333
-
334
-
335
-
336
-
337
-
338
-
339
-
340
-
341
-
342
-
343
-
344
-
345
-
346
-
347
-
348
-
349
-
350
-
351
-
352
-
353
-
354
-
355
-
356
-
357
-
358
-
359
-
360
-
361
-
362
-
363
-
364
-
365
-
366
-
367
-
368
-
369
-
370
-
371
-
372
-
373
-
374
-
375
-
376
-
377
-
378
-
379
-
380
-
381
-
382
-
383
-
384
-
385
-
386
-
387
-
388
-
389
-
390
-
391
-
392
-
393
-
394
-
395
-
396
-
397
-
398
-
399
-
400
-
401
-
402
-
403
-
404
-
405
-
406
-
407
-
408
-
409
-
410
-
411
-
412
-
413
-
414
-
415
-
416
-
417
-
418
-
419
-
420
-
421
-
422
-
423
-
424
-
425
-
426
-
427
-
428
-
429
-
430
-
431
-
432
-
433
-
434
-
435
-
436
-
437
-
438
-
439
-
440
-
441
-
442
-
443
-
444
-
445
-
446
-
447
-
448
-
449
-
450
-
451
-
452
-
453
-
454
-
455
-
456
-
457
-
458
-
459
-
460
-
461
-
462
-
463
-
464
-
465
-
466
-
467
-
468
-
469
-
470
-
471
-
472
-
473
-
474
-
475
-
476
-
477
-
478
-
479
-
480
-
481
-
482
-
483
-
484
-
485
-
486
-
487
-
488
-
489
-
490
-
491
-
492
-
493
-
494
-
495
-
496
-
497
-
498
-
499
-
500
-
501
-
502
-
503
-
504
-
505
-
506
-
507
-
508
-
509
-
510
-
511
-
512
-
513
-
514
-
515
-
516
-
517
-
518
-
519
-
520
-
521
-
522
-
523
-
524
-
525
-
526
-
527
-
528
-
529
-
530
-
531
-
532
-
533
-
534
-
535
-
536
-
537
-
538
-
539
-
540
-
541
-
542
-
543
-
544
-
545
-
546
-
547
-
548
-
549
-
550
-
551
-
552
-
553
-
554
-
555
-
556
-
557
-
558
-
559
-
560
-
561
-
562
-
563
-
564
 |
 |

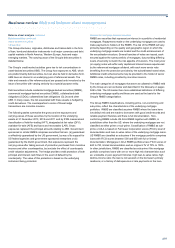
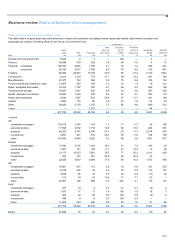
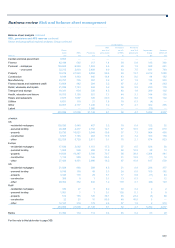
Business review Risk and balance sheet management
292
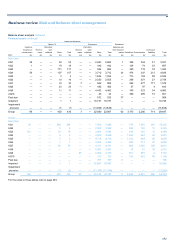
Balance sheet analysis continued
Debt securities continued
Ratings
The table below summarises the ratings of asset-backed securities on the balance sheet.
RMBS
Government MBS ABS
sponsored Non- covered covered Other
or similar (1) Prime conforming Sub-prime bond CMBS CDOs CLOs bond ABS Total
2013 £m £m £m £m £m £m £m £m £m £m £m
A
AA 871 2,974 790 24 145 165 66 313 — 1,448 6,796
A
A to AA+ 16,226 192 634 28 216 3,224 — 309 48 177 21,054
A
to AA- 158 151 227 34 48 60 60 167 — 565 1,470
BBB- to A- 13 126 162 95 3,806 102 25 165 — 447 4,941
Non-investment grade (2) 5 559 369 492 351 160 258 144 — 233 2,571
Unrated (3) — 100 16 225 —498 21 118 — 476 1,454
17,273 4,102 2,198 898 4,566 4,209 430 1,216 48 3,346 38,286
Of which in Non-Core — 42 288 164 —18 331 569 — 458 1,870
2012
A
AA 2,454 2,854 1,487 11 639 396 92 1,181 165 1,479 10,758
A
A to AA+ 23,692 613 88 26 102 2,551 7 887 340 469 28,775
A
to AA- 201 302 275 33 155 808 74 146 20 883 2,897
BBB- to A- 990 53 141 86 4,698 441 32 291 8 654 7,394
Non-investment grade (2) 20 641 454 330 136 304 421 133 — 235 2,674
Unrated (3) — 108 8298 —23 94 388 — 168 1,087
27,357 4,571 2,453 784 5,730 4,523 720 3,026 533 3,888 53,585
Of which in Non-Core — 651 404 154 —780 494 2,228 — 850 5,561
2011
A
AA 4,169 3,599 1,488 105 2,595 647 135 2,171 625 1,622 17,156
A
A to AA+ 29,252 669 106 60 379 710 35 1,533 321 550 33,615
A
to AA- 131 506 110 104 2,567 1,230 161 697 100 725 6,331
BBB- to A- — 39 288 93 1,979 333 86 341 — 1,321 4,480
Non-investment grade (2) 21 784 658 396 —415 1,370 176 — 672 4,492
Unrated (3) — 148 29 146 —56 170 423 — 263 1,235
33,573 5,745 2,679 904 7,520 3,391 1,957 5,341 1,046 5,153 67,309
Of which in Non-Core — 837 477 308 —830 1,656 4,227 — 1,861 10,196
Notes:
(1) Includes US agency and Dutch government guaranteed securities.
(2) Comprises HFT £1,275 million (2012 - £1,177 million; 2011 - £1,682 million), DFV nil (2012 - £7 million; 2011 - nil), AFS £1,138 million (2012 - £1,173 million; 2011 - £2,056 million) and LAR £158
million (2012 - £317 million; 2011 - £754 million).
(3) Comprises HFT £504 million (2012 - £808 million; 2011 - £804 million), AFS £26 million (2012 - £149 million; 2011 - £249 million) and LAR £924 million (2012 - £130 million; 2011 - £182 million).