RBS 2013 Annual Report Download - page 395
Download and view the complete annual report
Please find page 395 of the 2013 RBS annual report below. You can navigate through the pages in the report by either clicking on the pages listed below, or by using the keyword search tool below to find specific information within the annual report.-
 1
1 -
2
-
3
-
4
-
5
-
6
-
7
-
8
-
9
-
10
-
11
-
12
-
13
-
14
-
15
-
16
-
17
-
18
-
19
-
20
-
21
-
22
-
23
-
24
-
25
-
26
-
27
-
28
-
29
-
30
-
31
-
32
-
33
-
34
-
35
-
36
-
37
-
38
-
39
-
40
-
41
-
42
-
43
-
44
-
45
-
46
-
47
-
48
-
49
-
50
-
51
-
52
-
53
-
54
-
55
-
56
-
57
-
58
-
59
-
60
-
61
-
62
-
63
-
64
-
65
-
66
-
67
-
68
-
69
-
70
-
71
-
72
-
73
-
74
-
75
-
76
-
77
-
78
-
79
-
80
-
81
-
82
-
83
-
84
-
85
-
86
-
87
-
88
-
89
-
90
-
91
-
92
-
93
-
94
-
95
-
96
-
97
-
98
-
99
-
100
-
101
-
102
-
103
-
104
-
105
-
106
-
107
-
108
-
109
-
110
-
111
-
112
-
113
-
114
-
115
-
116
-
117
-
118
-
119
-
120
-
121
-
122
-
123
-
124
-
125
-
126
-
127
-
128
-
129
-
130
-
131
-
132
-
133
-
134
-
135
-
136
-
137
-
138
-
139
-
140
-
141
-
142
-
143
-
144
-
145
-
146
-
147
-
148
-
149
-
150
-
151
-
152
-
153
-
154
-
155
-
156
-
157
-
158
-
159
-
160
-
161
-
162
-
163
-
164
-
165
-
166
-
167
-
168
-
169
-
170
-
171
-
172
-
173
-
174
-
175
-
176
-
177
-
178
-
179
-
180
-
181
-
182
-
183
-
184
-
185
-
186
-
187
-
188
-
189
-
190
-
191
-
192
-
193
-
194
-
195
-
196
-
197
-
198
-
199
-
200
-
201
-
202
-
203
-
204
-
205
-
206
-
207
-
208
-
209
-
210
-
211
-
212
-
213
-
214
-
215
-
216
-
217
-
218
-
219
-
220
-
221
-
222
-
223
-
224
-
225
-
226
-
227
-
228
-
229
-
230
-
231
-
232
-
233
-
234
-
235
-
236
-
237
-
238
-
239
-
240
-
241
-
242
-
243
-
244
-
245
-
246
-
247
-
248
-
249
-
250
-
251
-
252
-
253
-
254
-
255
-
256
-
257
-
258
-
259
-
260
-
261
-
262
-
263
-
264
-
265
-
266
-
267
-
268
-
269
-
270
-
271
-
272
-
273
-
274
-
275
-
276
-
277
-
278
-
279
-
280
-
281
-
282
-
283
-
284
-
285
-
286
-
287
-
288
-
289
-
290
-
291
-
292
-
293
-
294
-
295
-
296
-
297
-
298
-
299
-
300
-
301
-
302
-
303
-
304
-
305
-
306
-
307
-
308
-
309
-
310
-
311
-
312
-
313
-
314
-
315
-
316
-
317
-
318
-
319
-
320
-
321
-
322
-
323
-
324
-
325
-
326
-
327
-
328
-
329
-
330
-
331
-
332
-
333
-
334
-
335
-
336
-
337
-
338
-
339
-
340
-
341
-
342
-
343
-
344
-
345
-
346
-
347
-
348
-
349
-
350
-
351
-
352
-
353
-
354
-
355
-
356
-
357
-
358
-
359
-
360
-
361
-
362
-
363
-
364
-
365
-
366
-
367
-
368
-
369
-
370
-
371
-
372
-
373
-
374
-
375
-
376
-
377
-
378
-
379
-
380
-
381
-
382
-
383
-
384
-
 385
385 -
 386
386 -
 387
387 -
 388
388 -
 389
389 -
 390
390 -
 391
391 -
 392
392 -
 393
393 -
 394
394 -
 395
395 -
 396
396 -
 397
397 -
 398
398 -
 399
399 -
 400
400 -
 401
401 -
 402
402 -
 403
403 -
 404
404 -
 405
405 -
406
-
407
-
408
-
409
-
410
-
411
-
412
-
413
-
414
-
415
-
416
-
417
-
418
-
419
-
420
-
421
-
422
-
423
-
424
-
425
-
426
-
427
-
428
-
429
-
430
-
431
-
432
-
433
-
434
-
435
-
436
-
437
-
438
-
439
-
440
-
441
-
442
-
443
-
444
-
445
-
446
-
447
-
448
-
449
-
450
-
451
-
452
-
453
-
454
-
455
-
456
-
457
-
458
-
459
-
460
-
461
-
462
-
463
-
464
-
465
-
466
-
467
-
468
-
469
-
470
-
471
-
472
-
473
-
474
-
475
-
476
-
477
-
478
-
479
-
480
-
481
-
482
-
483
-
484
-
485
-
486
-
487
-
488
-
489
-
490
-
491
-
492
-
493
-
494
-
495
-
496
-
497
-
498
-
499
-
500
-
501
-
502
-
503
-
504
-
505
-
506
-
507
-
508
-
509
-
510
-
511
-
512
-
513
-
514
-
515
-
516
-
517
-
518
-
519
-
520
-
521
-
522
-
523
-
524
-
525
-
526
-
527
-
528
-
529
-
530
-
531
-
532
-
533
-
534
-
535
-
536
-
537
-
538
-
539
-
540
-
541
-
542
-
543
-
544
-
545
-
546
-
547
-
548
-
549
-
550
-
551
-
552
-
553
-
554
-
555
-
556
-
557
-
558
-
559
-
560
-
561
-
562
-
563
-
564
 |
 |

Notes on the consolidated accounts
393
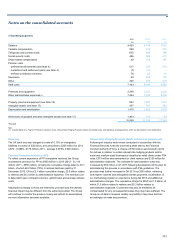
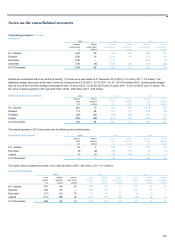
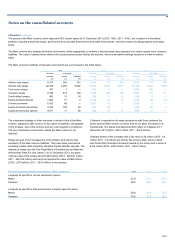
3 Operating expenses
2013 2012* 2011*
£m £m £m
Salaries 4,429 4,748 5,025
Variable compensation 588 716 975
Temporary and contract costs 650 699 786
Social security costs 486 562 615
Share-based compensation 49 126 197
Pension costs
- defined benefit schemes (see Note 4) 517 528 554
- curtailment and settlement gains (see Note 4) (7) (41) —
- defined contribution schemes 76 29 57
Severance 69 426 135
Other 306 395 218
Staff costs 7,163 8,188 8,562
Premises and equipment 2,348 2,232 2,423
Other administrative expenses (1) 7,244 5,593 4,436
Property, plant and equipment (see Note 18) 853 1,097 1,254
Intangible assets (see Note 17) 557 705 585
Depreciation and amortisation 1,410 1,802 1,839
Write-down of goodwill and other intangible assets (see Note 17) 1,403 124 80
19,568 17,939 17,340
*Restated
Note:
(1) Includes Bank levy, Payment Protection Insurance costs, Interest Rate Hedging Products redress and related costs, and regulatory and legal actions, which are discussed in more detail below.
Bank levy
The UK bank levy was charged at a rate of 0.13% on chargeable
liabilities in excess of £20 billion, and amounted to £200 million for 2013
(2012 - 0.088%, £175 million; 2011 - average 0.075%, £300 million).
Payment Protection Insurance (PPI)
To reflect current experience of PPI complaints received, the Group
increased its provision for PPI by £900 million in 2013 (2012 - £1,110
million; 2011 - £850 million), bringing the cumulative charge taken to £3.1
billion, of which £2.2 billion (70%) in redress had been paid by 31
December 2013. Of the £3.1 billion cumulative charge, £2.8 billion relates
to redress and £0.3 billion to administrative expenses. The eventual cost
is dependent upon complaint volumes, uphold rates and average redress
costs.
Assumptions relating to these are inherently uncertain and the ultimate
financial impact may be different from the amount provided. The Group
will continue to monitor the position closely and refresh its assumptions
as more information becomes available.
Interest Rate Hedging Products (IRHP) redress and related costs
Following an industry-wide review conducted in conjunction with the
Financial Services Authority (now being dealt with by the Financial
Conduct Authority (FCA)), a charge of £700 million was booked in 2012
for redress in relation to certain interest rate hedging products sold to
small and medium-sized businesses classified as retail clients under FSA
rules. £575 million was earmarked for client redress and £125 million for
administrative expenses. The estimate for administrative costs was
increased by £50 million in Q1 2013 following development of the plan for
administering this process in accordance with FSA guidelines. The
provision was further increased in Q4 2013 by £500 million, reflecting
both higher volumes and anticipated redress payments, recalibration of
our methodology based on experience during Q4 2013 and additional
administration charges. The cumulative charge for IRHP is £1.3 billion, of
which £1.0 billion relates to redress and £0.3 billion relates to
administrative expenses. Customers may also be entitled to be
compensated for any consequential losses they may have suffered. The
Group is not able to measure reliably any liability it may have and has
accordingly not made any provision.