RBS 2013 Annual Report Download - page 512
Download and view the complete annual report
Please find page 512 of the 2013 RBS annual report below. You can navigate through the pages in the report by either clicking on the pages listed below, or by using the keyword search tool below to find specific information within the annual report.-
 1
1 -
2
-
3
-
4
-
5
-
6
-
7
-
8
-
9
-
10
-
11
-
12
-
13
-
14
-
15
-
16
-
17
-
18
-
19
-
20
-
21
-
22
-
23
-
24
-
25
-
26
-
27
-
28
-
29
-
30
-
31
-
32
-
33
-
34
-
35
-
36
-
37
-
38
-
39
-
40
-
41
-
42
-
43
-
44
-
45
-
46
-
47
-
48
-
49
-
50
-
51
-
52
-
53
-
54
-
55
-
56
-
57
-
58
-
59
-
60
-
61
-
62
-
63
-
64
-
65
-
66
-
67
-
68
-
69
-
70
-
71
-
72
-
73
-
74
-
75
-
76
-
77
-
78
-
79
-
80
-
81
-
82
-
83
-
84
-
85
-
86
-
87
-
88
-
89
-
90
-
91
-
92
-
93
-
94
-
95
-
96
-
97
-
98
-
99
-
100
-
101
-
102
-
103
-
104
-
105
-
106
-
107
-
108
-
109
-
110
-
111
-
112
-
113
-
114
-
115
-
116
-
117
-
118
-
119
-
120
-
121
-
122
-
123
-
124
-
125
-
126
-
127
-
128
-
129
-
130
-
131
-
132
-
133
-
134
-
135
-
136
-
137
-
138
-
139
-
140
-
141
-
142
-
143
-
144
-
145
-
146
-
147
-
148
-
149
-
150
-
151
-
152
-
153
-
154
-
155
-
156
-
157
-
158
-
159
-
160
-
161
-
162
-
163
-
164
-
165
-
166
-
167
-
168
-
169
-
170
-
171
-
172
-
173
-
174
-
175
-
176
-
177
-
178
-
179
-
180
-
181
-
182
-
183
-
184
-
185
-
186
-
187
-
188
-
189
-
190
-
191
-
192
-
193
-
194
-
195
-
196
-
197
-
198
-
199
-
200
-
201
-
202
-
203
-
204
-
205
-
206
-
207
-
208
-
209
-
210
-
211
-
212
-
213
-
214
-
215
-
216
-
217
-
218
-
219
-
220
-
221
-
222
-
223
-
224
-
225
-
226
-
227
-
228
-
229
-
230
-
231
-
232
-
233
-
234
-
235
-
236
-
237
-
238
-
239
-
240
-
241
-
242
-
243
-
244
-
245
-
246
-
247
-
248
-
249
-
250
-
251
-
252
-
253
-
254
-
255
-
256
-
257
-
258
-
259
-
260
-
261
-
262
-
263
-
264
-
265
-
266
-
267
-
268
-
269
-
270
-
271
-
272
-
273
-
274
-
275
-
276
-
277
-
278
-
279
-
280
-
281
-
282
-
283
-
284
-
285
-
286
-
287
-
288
-
289
-
290
-
291
-
292
-
293
-
294
-
295
-
296
-
297
-
298
-
299
-
300
-
301
-
302
-
303
-
304
-
305
-
306
-
307
-
308
-
309
-
310
-
311
-
312
-
313
-
314
-
315
-
316
-
317
-
318
-
319
-
320
-
321
-
322
-
323
-
324
-
325
-
326
-
327
-
328
-
329
-
330
-
331
-
332
-
333
-
334
-
335
-
336
-
337
-
338
-
339
-
340
-
341
-
342
-
343
-
344
-
345
-
346
-
347
-
348
-
349
-
350
-
351
-
352
-
353
-
354
-
355
-
356
-
357
-
358
-
359
-
360
-
361
-
362
-
363
-
364
-
365
-
366
-
367
-
368
-
369
-
370
-
371
-
372
-
373
-
374
-
375
-
376
-
377
-
378
-
379
-
380
-
381
-
382
-
383
-
384
-
385
-
386
-
387
-
388
-
389
-
390
-
391
-
392
-
393
-
394
-
395
-
396
-
397
-
398
-
399
-
400
-
401
-
402
-
403
-
404
-
405
-
406
-
407
-
408
-
409
-
410
-
411
-
412
-
413
-
414
-
415
-
416
-
417
-
418
-
419
-
420
-
421
-
422
-
423
-
424
-
425
-
426
-
427
-
428
-
429
-
430
-
431
-
432
-
433
-
434
-
435
-
436
-
437
-
438
-
439
-
440
-
441
-
442
-
443
-
444
-
445
-
446
-
447
-
448
-
449
-
450
-
451
-
452
-
453
-
454
-
455
-
456
-
457
-
458
-
459
-
460
-
461
-
462
-
463
-
464
-
465
-
466
-
467
-
468
-
469
-
470
-
471
-
472
-
473
-
474
-
475
-
476
-
477
-
478
-
479
-
480
-
481
-
482
-
483
-
484
-
485
-
486
-
487
-
488
-
489
-
490
-
491
-
492
-
493
-
494
-
495
-
496
-
497
-
498
-
499
-
500
-
501
-
 502
502 -
 503
503 -
 504
504 -
 505
505 -
 506
506 -
 507
507 -
 508
508 -
 509
509 -
 510
510 -
 511
511 -
 512
512 -
 513
513 -
 514
514 -
 515
515 -
 516
516 -
 517
517 -
 518
518 -
 519
519 -
 520
520 -
 521
521 -
 522
522 -
523
-
524
-
525
-
526
-
527
-
528
-
529
-
530
-
531
-
532
-
533
-
534
-
535
-
536
-
537
-
538
-
539
-
540
-
541
-
542
-
543
-
544
-
545
-
546
-
547
-
548
-
549
-
550
-
551
-
552
-
553
-
554
-
555
-
556
-
557
-
558
-
559
-
560
-
561
-
562
-
563
-
564
 |
 |

Additional information
510
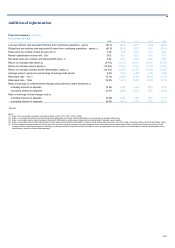
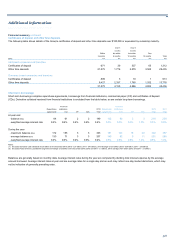
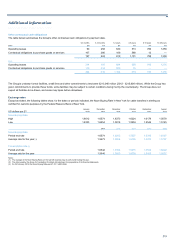
Financial summary continued
Other financial data
2013 2012* 2011* 2010* 2009*
Loss per ordinary and equivalent B share from continuing operations - pence (81.3) (54.5) (22.7) (3.9) (58.4)
Diluted loss per ordinary and equivalent B share from continuing operations - pence (1) (81.3) (54.5) (22.7) (3.9) (58.4)
Share price per ordinary share at year end - £ 3.38 3.25 2.02 3.91 2.92
Market capitalisation at year end - £bn 38.2 36.3 22.3 42.8 31.4
Net asset value per ordinary and equivalent B share - £ 5.24 6.31 6.90 7.02 8.81
Return on average total assets (2) (0.7%) (0.4%) (0.1%) (0.1%) (0.2%)
Return on average owners equity (3) (12.6%) (7.8%) (2.8%) (1.5%) (4.9%)
Return on average ordinary and B shareholders' equity (4) (14.5%) (8.9%) (3.1%) (0.9%) (7.4%)
A
verage owners' equity as a percentage of average total assets 5.6% 5.2% 4.9% 4.6% 2.8%
Risk asset ratio - Tier 1 13.1% 12.4% 13.0% 12.9% 14.1%
Risk asset ratio - Total 16.5% 14.5% 13.8% 14.0% 16.1%
Ratio of earnings to combined fixed charges and preference share dividends (5)
- including interest on deposits (0.34) 0.28 0.85 0.95 0.72
- excluding interest on deposits (4.51) (2.99) (0.37) 0.50 (0.47)
Ratio of earnings to fixed charges only (5)
- including interest on deposits (0.36) 0.29 0.85 0.97 0.77
- excluding interest on deposits (6.04) (3.81) (0.37) 0.58 (0.71)
*Restated
Notes:
(1) None of the convertible securities had a dilutive effect in 2013, 2012, 2011, 2010 or 2009.
(2) Return on average total assets represents (loss)/profit attributable to ordinary and B shareholders as a percentage of average total assets.
(3) Return on average owners equity represents (loss)/profit attributable to equity owners expressed as a percentage of average owners equity.
(4) Return on average ordinary and B shareholders' equity represents (loss)/profit attributable to ordinary and B shareholders expressed as a percentage of average ordinary and B shareholders' equity.
(5) For this purpose, earnings consist of income before tax and non-controlling interests, plus fixed charges less the unremitted income of associates (share of profits less dividends received). Fixed
charges consist of total interest expense, including or excluding interest on deposits and debt securities in issue, as appropriate, and the proportion of rental expense deemed representative of the
interest factor (one third of total rental expenses).