RBS 2013 Annual Report Download - page 259
Download and view the complete annual report
Please find page 259 of the 2013 RBS annual report below. You can navigate through the pages in the report by either clicking on the pages listed below, or by using the keyword search tool below to find specific information within the annual report.-
 1
1 -
2
-
3
-
4
-
5
-
6
-
7
-
8
-
9
-
10
-
11
-
12
-
13
-
14
-
15
-
16
-
17
-
18
-
19
-
20
-
21
-
22
-
23
-
24
-
25
-
26
-
27
-
28
-
29
-
30
-
31
-
32
-
33
-
34
-
35
-
36
-
37
-
38
-
39
-
40
-
41
-
42
-
43
-
44
-
45
-
46
-
47
-
48
-
49
-
50
-
51
-
52
-
53
-
54
-
55
-
56
-
57
-
58
-
59
-
60
-
61
-
62
-
63
-
64
-
65
-
66
-
67
-
68
-
69
-
70
-
71
-
72
-
73
-
74
-
75
-
76
-
77
-
78
-
79
-
80
-
81
-
82
-
83
-
84
-
85
-
86
-
87
-
88
-
89
-
90
-
91
-
92
-
93
-
94
-
95
-
96
-
97
-
98
-
99
-
100
-
101
-
102
-
103
-
104
-
105
-
106
-
107
-
108
-
109
-
110
-
111
-
112
-
113
-
114
-
115
-
116
-
117
-
118
-
119
-
120
-
121
-
122
-
123
-
124
-
125
-
126
-
127
-
128
-
129
-
130
-
131
-
132
-
133
-
134
-
135
-
136
-
137
-
138
-
139
-
140
-
141
-
142
-
143
-
144
-
145
-
146
-
147
-
148
-
149
-
150
-
151
-
152
-
153
-
154
-
155
-
156
-
157
-
158
-
159
-
160
-
161
-
162
-
163
-
164
-
165
-
166
-
167
-
168
-
169
-
170
-
171
-
172
-
173
-
174
-
175
-
176
-
177
-
178
-
179
-
180
-
181
-
182
-
183
-
184
-
185
-
186
-
187
-
188
-
189
-
190
-
191
-
192
-
193
-
194
-
195
-
196
-
197
-
198
-
199
-
200
-
201
-
202
-
203
-
204
-
205
-
206
-
207
-
208
-
209
-
210
-
211
-
212
-
213
-
214
-
215
-
216
-
217
-
218
-
219
-
220
-
221
-
222
-
223
-
224
-
225
-
226
-
227
-
228
-
229
-
230
-
231
-
232
-
233
-
234
-
235
-
236
-
237
-
238
-
239
-
240
-
241
-
242
-
243
-
244
-
245
-
246
-
247
-
248
-
 249
249 -
 250
250 -
 251
251 -
 252
252 -
 253
253 -
 254
254 -
 255
255 -
 256
256 -
 257
257 -
 258
258 -
 259
259 -
 260
260 -
 261
261 -
 262
262 -
 263
263 -
 264
264 -
 265
265 -
 266
266 -
 267
267 -
 268
268 -
 269
269 -
270
-
271
-
272
-
273
-
274
-
275
-
276
-
277
-
278
-
279
-
280
-
281
-
282
-
283
-
284
-
285
-
286
-
287
-
288
-
289
-
290
-
291
-
292
-
293
-
294
-
295
-
296
-
297
-
298
-
299
-
300
-
301
-
302
-
303
-
304
-
305
-
306
-
307
-
308
-
309
-
310
-
311
-
312
-
313
-
314
-
315
-
316
-
317
-
318
-
319
-
320
-
321
-
322
-
323
-
324
-
325
-
326
-
327
-
328
-
329
-
330
-
331
-
332
-
333
-
334
-
335
-
336
-
337
-
338
-
339
-
340
-
341
-
342
-
343
-
344
-
345
-
346
-
347
-
348
-
349
-
350
-
351
-
352
-
353
-
354
-
355
-
356
-
357
-
358
-
359
-
360
-
361
-
362
-
363
-
364
-
365
-
366
-
367
-
368
-
369
-
370
-
371
-
372
-
373
-
374
-
375
-
376
-
377
-
378
-
379
-
380
-
381
-
382
-
383
-
384
-
385
-
386
-
387
-
388
-
389
-
390
-
391
-
392
-
393
-
394
-
395
-
396
-
397
-
398
-
399
-
400
-
401
-
402
-
403
-
404
-
405
-
406
-
407
-
408
-
409
-
410
-
411
-
412
-
413
-
414
-
415
-
416
-
417
-
418
-
419
-
420
-
421
-
422
-
423
-
424
-
425
-
426
-
427
-
428
-
429
-
430
-
431
-
432
-
433
-
434
-
435
-
436
-
437
-
438
-
439
-
440
-
441
-
442
-
443
-
444
-
445
-
446
-
447
-
448
-
449
-
450
-
451
-
452
-
453
-
454
-
455
-
456
-
457
-
458
-
459
-
460
-
461
-
462
-
463
-
464
-
465
-
466
-
467
-
468
-
469
-
470
-
471
-
472
-
473
-
474
-
475
-
476
-
477
-
478
-
479
-
480
-
481
-
482
-
483
-
484
-
485
-
486
-
487
-
488
-
489
-
490
-
491
-
492
-
493
-
494
-
495
-
496
-
497
-
498
-
499
-
500
-
501
-
502
-
503
-
504
-
505
-
506
-
507
-
508
-
509
-
510
-
511
-
512
-
513
-
514
-
515
-
516
-
517
-
518
-
519
-
520
-
521
-
522
-
523
-
524
-
525
-
526
-
527
-
528
-
529
-
530
-
531
-
532
-
533
-
534
-
535
-
536
-
537
-
538
-
539
-
540
-
541
-
542
-
543
-
544
-
545
-
546
-
547
-
548
-
549
-
550
-
551
-
552
-
553
-
554
-
555
-
556
-
557
-
558
-
559
-
560
-
561
-
562
-
563
-
564
 |
 |

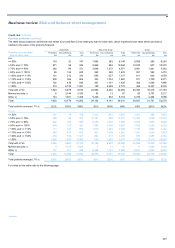
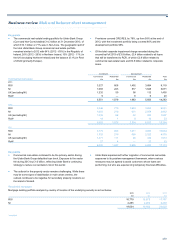
Business review Risk and balance sheet management
257
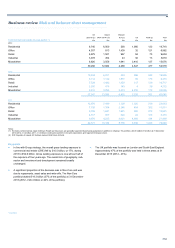
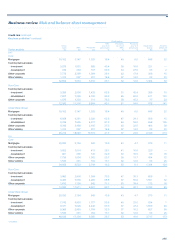
Ulster Bank Rest of the Group Group
Performing Non-performing Total Performing Non-performing Total Performing Non-performing Total
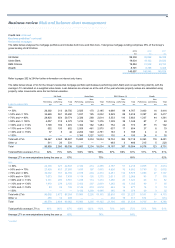
Commercial real estate
loan-to-value ratio £m £m £m £m £m £m £m £m £m
2011
<= 50% 272 32 304 7,091 332 7,423 7,363 364 7,727
> 50% and <= 70% 479 127 606 14,105 984 15,089 14,584 1,111 15,695
> 70% and <= 90% 808 332 1,140 10,042 1,191 11,233 10,850 1,523 12,373
> 90% and <= 100% 438 201 639 2,616 1,679 4,295 3,054 1,880 4,934
> 100% and <= 110% 474 390 864 1,524 1,928 3,452 1,998 2,318 4,316
> 110% and <= 130% 527 1,101 1,628 698 1,039 1,737 1,225 2,140 3,365
> 130% and <= 150% 506 1,066 1,572 239 912 1,151 745 1,978 2,723
> 150% 912 7,472 8,384 433 2,082 2,515 1,345 9,554 10,899
Total with LTVs 4,416 10,721 15,137 36,748 10,147 46,895 41,164 20,868 62,032
Minimal security (1) 72 1,086 1,158 — — — 72 1,086 1,158
Other (2) 193 625 818 8,994 1,844 10,838 9,187 2,469 11,656
Total 4,681 12,432 17,113 45,742 11,991 57,733 50,423 24,423 74,846
Total portfolio average LTV (3) 120% 264% 222% 69% 129% 82% 75% 203% 116%
Notes:
(1) In 2012, the Group reclassified loans with limited (defined as LTV>1,000%) or non-physical security as minimal security, of which a majority were commercial real estate development loans in Ulster
Bank. Total portfolio average LTV is quoted net of loans with minimal security given that the anticipated recovery rate is less than 10%. Provisions are marked against these loans where required to
reflect the relevant asset quality and recovery profile.
(2) Other non-performing loans of £2.3 billion (2012 - £2.0 billion; 2011 - £2.5 billion) were subject to the Group’s standard provisioning policies. Other performing loans of £5.4 billion (2012 - £6.6 billion;
2011 - £9.2 billion) included general corporate loans, typically unsecured, to commercial real estate companies, and major UK house builders in addition to facilities supported by guarantees. The
credit quality of these exposures was consistent with that of the performing portfolio overall.
(3) Weighted average by exposure.
(4) 2012 LTV revised to reflect refinement to security value reporting implemented during 2013.
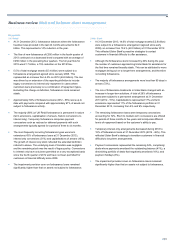
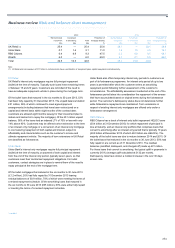
Key points
• The reductions in the higher LTV buckets for the performing book
were offset by the growth in these buckets in the non-performing
book. Ulster Bank Group accounted for the majority of this
deterioration and has addressed this through an increase in
provisions (refer to the section on RCR). Ulster Bank Group's
provision as a percentage of REIL stood at 76% at 31 December
2013 (2012 - 57%). Valuations continued to be affected by difficult,
although improving, market conditions, as well as refinements to the
Group’s estimation approach.
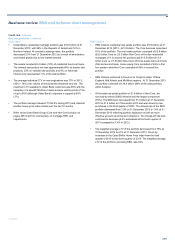
• Interest payable on outstanding loans was covered 3.1x and 1.6x
within UK Corporate and International Banking, respectively, at 31
December 2013 (2012 - 3.0x and 1.5x respectively). The US Retail
& Commercial portfolio is managed on the basis of debt service
coverage, which includes principal amortisation as well as interest
payable. The average debt service coverage was 1.5x at 31
December 2013 (2012 - 1.3x). As a number of different approaches
are used across the Group and across geographies to calculate
interest coverage ratios, they may not be comparable for different
portfolio types and legal entities.
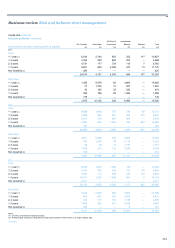
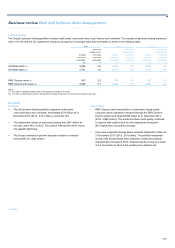
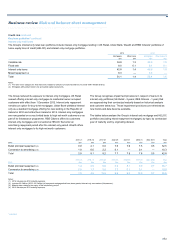
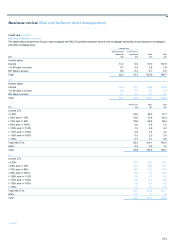
Credit quality metrics relating to commercial real estate lending were as follows:
Group Non-Core
2013 2012 2011 2013 2012 2011
Lending (gross) £52.6bn £63.0bn £74.8bn £19.3bn £26.4bn £34.3bn
Of which REIL £20.1bn £22.1bn £22.9bn £14.3bn £17.1bn £18.8bn
Provisions £13.2bn £10.1bn £9.5bn £10.6bn £8.3bn £8.2bn
REIL as a % of gross loans to customers 38.2% 35.1% 30.6% 74.1% 64.8% 54.8%
Provisions as a % of REIL 66% 46% 41% 74% 49% 44%
Note:
(1) Excludes property related lending to customers in other sectors managed by Real Estate Finance.
Key point
• CRE lending net of impairment provisions decreased by £13.5 billion or 26% in the year to £39.4 billion in part due to the increased impairment
provisions recorded in the fourth quarter of 2013 in Ulster Bank Non-Core, as part of RCR creation and related strategy. Provision coverage on
CRE REIL was 66% compared to 46% at the end of 2012.
Ulster Bank is a significant contributor to Non-Core commercial real estate lending. For further information refer to the section on Ulster Bank Group
(Core and Non-Core).
*unaudited