RBS 2013 Annual Report Download - page 299
Download and view the complete annual report
Please find page 299 of the 2013 RBS annual report below. You can navigate through the pages in the report by either clicking on the pages listed below, or by using the keyword search tool below to find specific information within the annual report.-
 1
1 -
2
-
3
-
4
-
5
-
6
-
7
-
8
-
9
-
10
-
11
-
12
-
13
-
14
-
15
-
16
-
17
-
18
-
19
-
20
-
21
-
22
-
23
-
24
-
25
-
26
-
27
-
28
-
29
-
30
-
31
-
32
-
33
-
34
-
35
-
36
-
37
-
38
-
39
-
40
-
41
-
42
-
43
-
44
-
45
-
46
-
47
-
48
-
49
-
50
-
51
-
52
-
53
-
54
-
55
-
56
-
57
-
58
-
59
-
60
-
61
-
62
-
63
-
64
-
65
-
66
-
67
-
68
-
69
-
70
-
71
-
72
-
73
-
74
-
75
-
76
-
77
-
78
-
79
-
80
-
81
-
82
-
83
-
84
-
85
-
86
-
87
-
88
-
89
-
90
-
91
-
92
-
93
-
94
-
95
-
96
-
97
-
98
-
99
-
100
-
101
-
102
-
103
-
104
-
105
-
106
-
107
-
108
-
109
-
110
-
111
-
112
-
113
-
114
-
115
-
116
-
117
-
118
-
119
-
120
-
121
-
122
-
123
-
124
-
125
-
126
-
127
-
128
-
129
-
130
-
131
-
132
-
133
-
134
-
135
-
136
-
137
-
138
-
139
-
140
-
141
-
142
-
143
-
144
-
145
-
146
-
147
-
148
-
149
-
150
-
151
-
152
-
153
-
154
-
155
-
156
-
157
-
158
-
159
-
160
-
161
-
162
-
163
-
164
-
165
-
166
-
167
-
168
-
169
-
170
-
171
-
172
-
173
-
174
-
175
-
176
-
177
-
178
-
179
-
180
-
181
-
182
-
183
-
184
-
185
-
186
-
187
-
188
-
189
-
190
-
191
-
192
-
193
-
194
-
195
-
196
-
197
-
198
-
199
-
200
-
201
-
202
-
203
-
204
-
205
-
206
-
207
-
208
-
209
-
210
-
211
-
212
-
213
-
214
-
215
-
216
-
217
-
218
-
219
-
220
-
221
-
222
-
223
-
224
-
225
-
226
-
227
-
228
-
229
-
230
-
231
-
232
-
233
-
234
-
235
-
236
-
237
-
238
-
239
-
240
-
241
-
242
-
243
-
244
-
245
-
246
-
247
-
248
-
249
-
250
-
251
-
252
-
253
-
254
-
255
-
256
-
257
-
258
-
259
-
260
-
261
-
262
-
263
-
264
-
265
-
266
-
267
-
268
-
269
-
270
-
271
-
272
-
273
-
274
-
275
-
276
-
277
-
278
-
279
-
280
-
281
-
282
-
283
-
284
-
285
-
286
-
287
-
288
-
 289
289 -
 290
290 -
 291
291 -
 292
292 -
 293
293 -
 294
294 -
 295
295 -
 296
296 -
 297
297 -
 298
298 -
 299
299 -
 300
300 -
 301
301 -
 302
302 -
 303
303 -
 304
304 -
 305
305 -
 306
306 -
 307
307 -
 308
308 -
 309
309 -
310
-
311
-
312
-
313
-
314
-
315
-
316
-
317
-
318
-
319
-
320
-
321
-
322
-
323
-
324
-
325
-
326
-
327
-
328
-
329
-
330
-
331
-
332
-
333
-
334
-
335
-
336
-
337
-
338
-
339
-
340
-
341
-
342
-
343
-
344
-
345
-
346
-
347
-
348
-
349
-
350
-
351
-
352
-
353
-
354
-
355
-
356
-
357
-
358
-
359
-
360
-
361
-
362
-
363
-
364
-
365
-
366
-
367
-
368
-
369
-
370
-
371
-
372
-
373
-
374
-
375
-
376
-
377
-
378
-
379
-
380
-
381
-
382
-
383
-
384
-
385
-
386
-
387
-
388
-
389
-
390
-
391
-
392
-
393
-
394
-
395
-
396
-
397
-
398
-
399
-
400
-
401
-
402
-
403
-
404
-
405
-
406
-
407
-
408
-
409
-
410
-
411
-
412
-
413
-
414
-
415
-
416
-
417
-
418
-
419
-
420
-
421
-
422
-
423
-
424
-
425
-
426
-
427
-
428
-
429
-
430
-
431
-
432
-
433
-
434
-
435
-
436
-
437
-
438
-
439
-
440
-
441
-
442
-
443
-
444
-
445
-
446
-
447
-
448
-
449
-
450
-
451
-
452
-
453
-
454
-
455
-
456
-
457
-
458
-
459
-
460
-
461
-
462
-
463
-
464
-
465
-
466
-
467
-
468
-
469
-
470
-
471
-
472
-
473
-
474
-
475
-
476
-
477
-
478
-
479
-
480
-
481
-
482
-
483
-
484
-
485
-
486
-
487
-
488
-
489
-
490
-
491
-
492
-
493
-
494
-
495
-
496
-
497
-
498
-
499
-
500
-
501
-
502
-
503
-
504
-
505
-
506
-
507
-
508
-
509
-
510
-
511
-
512
-
513
-
514
-
515
-
516
-
517
-
518
-
519
-
520
-
521
-
522
-
523
-
524
-
525
-
526
-
527
-
528
-
529
-
530
-
531
-
532
-
533
-
534
-
535
-
536
-
537
-
538
-
539
-
540
-
541
-
542
-
543
-
544
-
545
-
546
-
547
-
548
-
549
-
550
-
551
-
552
-
553
-
554
-
555
-
556
-
557
-
558
-
559
-
560
-
561
-
562
-
563
-
564
 |
 |

Business review Risk and balance sheet management
297
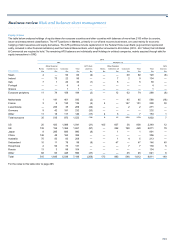
Key points
• Net exposure decreased by 47% (liabilities decreased by 38%)
reflecting increased interest rate yields and continued use of trade
compression cycles, partially offset by increased trade volumes.
• Interest rate contracts’ fair value decreased due to significant
upward shifts in major yield curves as the US Federal Reserve
announced tapering of quantitative easing from early 2014.
Continued participation in trade compression cycles contributed to a
further reduction in exposures.
• Exchange rate contracts’ fair value decreased due to strengthening
of sterling against the US dollar and decrease in trade volumes.
• The decrease in credit derivatives notional and fair values was
driven by increased use of trade compression cycles and novation of
certain trades in Markets in line with the Group’s risk reduction
strategy, primarily in the first half of the year. Tightening of credit
spreads also contributed to the decrease in fair value.
• Sales and reduction in trade volumes contributed to reduction in
equity contracts.
• Netting and collateral agreements with some financial institutions
(bank and non-bank) in certain jurisdictions, or due to other legal
reasons, are not deemed to be enforceable and are therefore
reported as uncollateralised above.
• 71% of the uncollateralised derivatives related to corporates rated
AQ1-AQ3.
• Corporate uncollateralised derivatives, principally all in Markets,
relate to large corporates who may have netting arrangements in
place but do not have collateral posting capability. A significant
proportion of the Group’s credit valuation adjustments and funding
valuation adjustments relate to those uncollateralised derivatives.
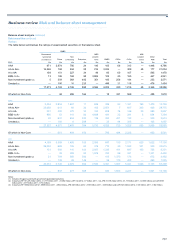
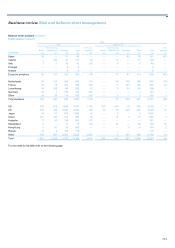
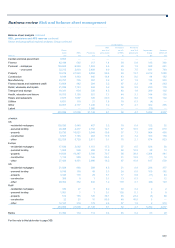
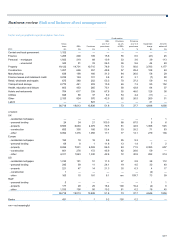
The table below analyses the Group’s derivative notional and fair values by trading and settlement method.
Notional Asset Liability
Traded over the counter
Traded on Not settled Traded on Traded Traded on Traded
recognised Settled by central by central recognised over the recognised over the
exchanges counterparties counterparties Total exchanges counter exchanges counter
2013 £bn £bn £bn £bn £m £m £m £m
Interest rate 2,203 22,565 10,821 35,589 65 217,976 79 208,619
Exchange rate 94 24,459 4,555 — 61,923 — 65,749
Credit — 30 223 253 — 5,306 — 5,388
Equity and commodity — 1 80 81 4 2,766 220 5,472
2012
Interest rate 2,388 15,864 15,231 33,483 13 363,441 55 345,510
Exchange rate 108 —4,590 4,698 — 63,067 — 70,481
Credit — — 553 553 — 11,005 — 10,353
Equity and commodity 1 —110 111 28 4,364 200 7,741
2011
Interest rate 2,653 16,377 19,697 38,727 3 422,550 5 406,779
Exchange rate 110 —4,372 4,482 — 74,526 — 81,022
Credit — — 1,054 1,054 — 26,836 — 26,743
Equity and commodity 2 —121 123 115 6,027 423 9,137