RBS 2013 Annual Report Download - page 453
Download and view the complete annual report
Please find page 453 of the 2013 RBS annual report below. You can navigate through the pages in the report by either clicking on the pages listed below, or by using the keyword search tool below to find specific information within the annual report.-
 1
1 -
2
-
3
-
4
-
5
-
6
-
7
-
8
-
9
-
10
-
11
-
12
-
13
-
14
-
15
-
16
-
17
-
18
-
19
-
20
-
21
-
22
-
23
-
24
-
25
-
26
-
27
-
28
-
29
-
30
-
31
-
32
-
33
-
34
-
35
-
36
-
37
-
38
-
39
-
40
-
41
-
42
-
43
-
44
-
45
-
46
-
47
-
48
-
49
-
50
-
51
-
52
-
53
-
54
-
55
-
56
-
57
-
58
-
59
-
60
-
61
-
62
-
63
-
64
-
65
-
66
-
67
-
68
-
69
-
70
-
71
-
72
-
73
-
74
-
75
-
76
-
77
-
78
-
79
-
80
-
81
-
82
-
83
-
84
-
85
-
86
-
87
-
88
-
89
-
90
-
91
-
92
-
93
-
94
-
95
-
96
-
97
-
98
-
99
-
100
-
101
-
102
-
103
-
104
-
105
-
106
-
107
-
108
-
109
-
110
-
111
-
112
-
113
-
114
-
115
-
116
-
117
-
118
-
119
-
120
-
121
-
122
-
123
-
124
-
125
-
126
-
127
-
128
-
129
-
130
-
131
-
132
-
133
-
134
-
135
-
136
-
137
-
138
-
139
-
140
-
141
-
142
-
143
-
144
-
145
-
146
-
147
-
148
-
149
-
150
-
151
-
152
-
153
-
154
-
155
-
156
-
157
-
158
-
159
-
160
-
161
-
162
-
163
-
164
-
165
-
166
-
167
-
168
-
169
-
170
-
171
-
172
-
173
-
174
-
175
-
176
-
177
-
178
-
179
-
180
-
181
-
182
-
183
-
184
-
185
-
186
-
187
-
188
-
189
-
190
-
191
-
192
-
193
-
194
-
195
-
196
-
197
-
198
-
199
-
200
-
201
-
202
-
203
-
204
-
205
-
206
-
207
-
208
-
209
-
210
-
211
-
212
-
213
-
214
-
215
-
216
-
217
-
218
-
219
-
220
-
221
-
222
-
223
-
224
-
225
-
226
-
227
-
228
-
229
-
230
-
231
-
232
-
233
-
234
-
235
-
236
-
237
-
238
-
239
-
240
-
241
-
242
-
243
-
244
-
245
-
246
-
247
-
248
-
249
-
250
-
251
-
252
-
253
-
254
-
255
-
256
-
257
-
258
-
259
-
260
-
261
-
262
-
263
-
264
-
265
-
266
-
267
-
268
-
269
-
270
-
271
-
272
-
273
-
274
-
275
-
276
-
277
-
278
-
279
-
280
-
281
-
282
-
283
-
284
-
285
-
286
-
287
-
288
-
289
-
290
-
291
-
292
-
293
-
294
-
295
-
296
-
297
-
298
-
299
-
300
-
301
-
302
-
303
-
304
-
305
-
306
-
307
-
308
-
309
-
310
-
311
-
312
-
313
-
314
-
315
-
316
-
317
-
318
-
319
-
320
-
321
-
322
-
323
-
324
-
325
-
326
-
327
-
328
-
329
-
330
-
331
-
332
-
333
-
334
-
335
-
336
-
337
-
338
-
339
-
340
-
341
-
342
-
343
-
344
-
345
-
346
-
347
-
348
-
349
-
350
-
351
-
352
-
353
-
354
-
355
-
356
-
357
-
358
-
359
-
360
-
361
-
362
-
363
-
364
-
365
-
366
-
367
-
368
-
369
-
370
-
371
-
372
-
373
-
374
-
375
-
376
-
377
-
378
-
379
-
380
-
381
-
382
-
383
-
384
-
385
-
386
-
387
-
388
-
389
-
390
-
391
-
392
-
393
-
394
-
395
-
396
-
397
-
398
-
399
-
400
-
401
-
402
-
403
-
404
-
405
-
406
-
407
-
408
-
409
-
410
-
411
-
412
-
413
-
414
-
415
-
416
-
417
-
418
-
419
-
420
-
421
-
422
-
423
-
424
-
425
-
426
-
427
-
428
-
429
-
430
-
431
-
432
-
433
-
434
-
435
-
436
-
437
-
438
-
439
-
440
-
441
-
442
-
 443
443 -
 444
444 -
 445
445 -
 446
446 -
 447
447 -
 448
448 -
 449
449 -
 450
450 -
 451
451 -
 452
452 -
 453
453 -
 454
454 -
 455
455 -
 456
456 -
 457
457 -
 458
458 -
 459
459 -
 460
460 -
 461
461 -
 462
462 -
 463
463 -
464
-
465
-
466
-
467
-
468
-
469
-
470
-
471
-
472
-
473
-
474
-
475
-
476
-
477
-
478
-
479
-
480
-
481
-
482
-
483
-
484
-
485
-
486
-
487
-
488
-
489
-
490
-
491
-
492
-
493
-
494
-
495
-
496
-
497
-
498
-
499
-
500
-
501
-
502
-
503
-
504
-
505
-
506
-
507
-
508
-
509
-
510
-
511
-
512
-
513
-
514
-
515
-
516
-
517
-
518
-
519
-
520
-
521
-
522
-
523
-
524
-
525
-
526
-
527
-
528
-
529
-
530
-
531
-
532
-
533
-
534
-
535
-
536
-
537
-
538
-
539
-
540
-
541
-
542
-
543
-
544
-
545
-
546
-
547
-
548
-
549
-
550
-
551
-
552
-
553
-
554
-
555
-
556
-
557
-
558
-
559
-
560
-
561
-
562
-
563
-
564
 |
 |

Notes on the consolidated accounts
451
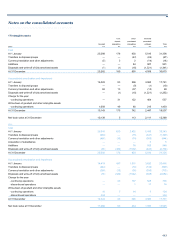
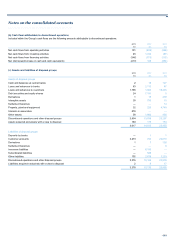
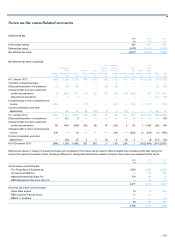
21 Short positions
2013 2012 2011
£m £m £m
Debt securities
- Government 24,661 23,551 32,895
- Other issuers 3,102 3,429 6,164
Equity shares 259 611 1,980
28,022 27,591 41,039
Note:
(1) All short positions are classified as held-for-trading.
22 Accruals, deferred income and other liabilities
2013 2012 2011
£m £m £m
Notes in circulation 1,759 1,684 1,683
Current tax 516 527 700
A
ccruals 3,116 3,579 4,941
Deferred income 589 875 3,481
Provisions for liabilities and charges (see table below) 5,489 3,147 1,311
Other liabilities (1) 4,548 4,989 11,088
16,017 14,801 23,204
Note:
(1) Other liabilities include £25 million (2012 - £24 million; 2011 - £15 million) in respect of share-based compensation.
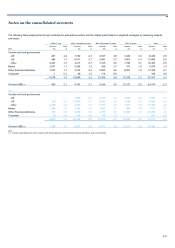
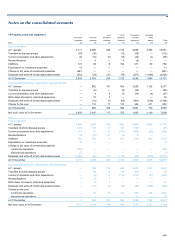
Paymen
t
Interest Rate Othe
r
Othe
r
Technology
Protection Hedging custome
r
regulatory incident
Insurance (1) Products (2) redress (3) LIBOR (4) provisions (5) Litigation (6) redress (7) Property (8) Othe
r
Total
Provisions for liabilities and charges £m £m £m £m £m £m £m £m £m £m
A
t 1 January 2013 895 676 162 381 200 168 28 392 245 3,147
Transfer from accruals and other liabilities — — — 10 10 — — 21 (21) 20
Currency translation and other movements — — (3) (2) — (25) — (2) (2) (34)
Charge to income statement 900 550 455 315 124 2,050 — 154 182 4,730
Releases to income statement — (3) —(123) (28) — (91) (63) (308)
Provisions utilised (869) (149) (274) (288) (61) (147) (28) (95) (155) (2,066)
A
t 31 December 2013 926 1,077 337 416 150 2,018 — 379 186 5,489
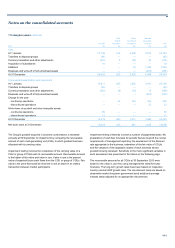
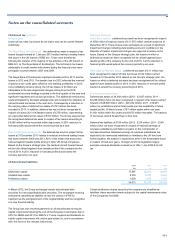
Notes:
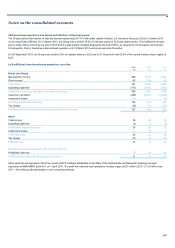
(1) The principal assumptions underlying the Group’s provision in respect of PPI sales are: assessment of the total number of complaints that the Group
will receive; the proportion of these that will result in redress; and the average cost of such redress. The number of complaints has been estimated
from an analysis of the Group’s portfolio of PPI policies sold by vintage and by product. Estimates of the percentage of policyholders that will lodge
complaints (the take up rate) and of the number of these that will be upheld (the uphold rate) have been established based on recent experience,
guidance in the FSA policy statements and expected rate of responses from proactive customer contact. The average redress assumption is based
on recent experience and the calculation rules in the FSA statement.
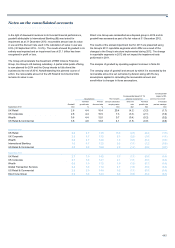
The table below shows the sensitivity of the provision to changes in the principal assumptions (all other assumptions remaining the same).
Sensitivity
Assumption
Actual
to date
Current
assumptions
Change in
assumption
%
Consequential
change in provision
£m
Take up rate 36% 38% +/-5 +/-45
Uphold rate (1) 84% 83% +/-5 +/-30
Average redress £1,733 £1,646 +/-5 +/-26
Note:
(1) Uphold rates exclude claims where no PPI policy was held.
Interest that will be payable on successful complaints has been included in the provision as has the estimated cost to the Group of administering the
redress process. The Group expects the majority of the cash outflows associated with this provision to have occurred by the end of 2014. There are
uncertainties as to the eventual cost of redress which will depend on actual complaint volumes, take up and uphold rates and average redress costs.
Background information in relation to PPI claims is given in Note 32.