RBS 2013 Annual Report Download - page 126
Download and view the complete annual report
Please find page 126 of the 2013 RBS annual report below. You can navigate through the pages in the report by either clicking on the pages listed below, or by using the keyword search tool below to find specific information within the annual report.-
 1
1 -
2
-
3
-
4
-
5
-
6
-
7
-
8
-
9
-
10
-
11
-
12
-
13
-
14
-
15
-
16
-
17
-
18
-
19
-
20
-
21
-
22
-
23
-
24
-
25
-
26
-
27
-
28
-
29
-
30
-
31
-
32
-
33
-
34
-
35
-
36
-
37
-
38
-
39
-
40
-
41
-
42
-
43
-
44
-
45
-
46
-
47
-
48
-
49
-
50
-
51
-
52
-
53
-
54
-
55
-
56
-
57
-
58
-
59
-
60
-
61
-
62
-
63
-
64
-
65
-
66
-
67
-
68
-
69
-
70
-
71
-
72
-
73
-
74
-
75
-
76
-
77
-
78
-
79
-
80
-
81
-
82
-
83
-
84
-
85
-
86
-
87
-
88
-
89
-
90
-
91
-
92
-
93
-
94
-
95
-
96
-
97
-
98
-
99
-
100
-
101
-
102
-
103
-
104
-
105
-
106
-
107
-
108
-
109
-
110
-
111
-
112
-
113
-
114
-
115
-
 116
116 -
 117
117 -
 118
118 -
 119
119 -
 120
120 -
 121
121 -
 122
122 -
 123
123 -
 124
124 -
 125
125 -
 126
126 -
 127
127 -
 128
128 -
 129
129 -
 130
130 -
 131
131 -
 132
132 -
 133
133 -
 134
134 -
 135
135 -
 136
136 -
137
-
138
-
139
-
140
-
141
-
142
-
143
-
144
-
145
-
146
-
147
-
148
-
149
-
150
-
151
-
152
-
153
-
154
-
155
-
156
-
157
-
158
-
159
-
160
-
161
-
162
-
163
-
164
-
165
-
166
-
167
-
168
-
169
-
170
-
171
-
172
-
173
-
174
-
175
-
176
-
177
-
178
-
179
-
180
-
181
-
182
-
183
-
184
-
185
-
186
-
187
-
188
-
189
-
190
-
191
-
192
-
193
-
194
-
195
-
196
-
197
-
198
-
199
-
200
-
201
-
202
-
203
-
204
-
205
-
206
-
207
-
208
-
209
-
210
-
211
-
212
-
213
-
214
-
215
-
216
-
217
-
218
-
219
-
220
-
221
-
222
-
223
-
224
-
225
-
226
-
227
-
228
-
229
-
230
-
231
-
232
-
233
-
234
-
235
-
236
-
237
-
238
-
239
-
240
-
241
-
242
-
243
-
244
-
245
-
246
-
247
-
248
-
249
-
250
-
251
-
252
-
253
-
254
-
255
-
256
-
257
-
258
-
259
-
260
-
261
-
262
-
263
-
264
-
265
-
266
-
267
-
268
-
269
-
270
-
271
-
272
-
273
-
274
-
275
-
276
-
277
-
278
-
279
-
280
-
281
-
282
-
283
-
284
-
285
-
286
-
287
-
288
-
289
-
290
-
291
-
292
-
293
-
294
-
295
-
296
-
297
-
298
-
299
-
300
-
301
-
302
-
303
-
304
-
305
-
306
-
307
-
308
-
309
-
310
-
311
-
312
-
313
-
314
-
315
-
316
-
317
-
318
-
319
-
320
-
321
-
322
-
323
-
324
-
325
-
326
-
327
-
328
-
329
-
330
-
331
-
332
-
333
-
334
-
335
-
336
-
337
-
338
-
339
-
340
-
341
-
342
-
343
-
344
-
345
-
346
-
347
-
348
-
349
-
350
-
351
-
352
-
353
-
354
-
355
-
356
-
357
-
358
-
359
-
360
-
361
-
362
-
363
-
364
-
365
-
366
-
367
-
368
-
369
-
370
-
371
-
372
-
373
-
374
-
375
-
376
-
377
-
378
-
379
-
380
-
381
-
382
-
383
-
384
-
385
-
386
-
387
-
388
-
389
-
390
-
391
-
392
-
393
-
394
-
395
-
396
-
397
-
398
-
399
-
400
-
401
-
402
-
403
-
404
-
405
-
406
-
407
-
408
-
409
-
410
-
411
-
412
-
413
-
414
-
415
-
416
-
417
-
418
-
419
-
420
-
421
-
422
-
423
-
424
-
425
-
426
-
427
-
428
-
429
-
430
-
431
-
432
-
433
-
434
-
435
-
436
-
437
-
438
-
439
-
440
-
441
-
442
-
443
-
444
-
445
-
446
-
447
-
448
-
449
-
450
-
451
-
452
-
453
-
454
-
455
-
456
-
457
-
458
-
459
-
460
-
461
-
462
-
463
-
464
-
465
-
466
-
467
-
468
-
469
-
470
-
471
-
472
-
473
-
474
-
475
-
476
-
477
-
478
-
479
-
480
-
481
-
482
-
483
-
484
-
485
-
486
-
487
-
488
-
489
-
490
-
491
-
492
-
493
-
494
-
495
-
496
-
497
-
498
-
499
-
500
-
501
-
502
-
503
-
504
-
505
-
506
-
507
-
508
-
509
-
510
-
511
-
512
-
513
-
514
-
515
-
516
-
517
-
518
-
519
-
520
-
521
-
522
-
523
-
524
-
525
-
526
-
527
-
528
-
529
-
530
-
531
-
532
-
533
-
534
-
535
-
536
-
537
-
538
-
539
-
540
-
541
-
542
-
543
-
544
-
545
-
546
-
547
-
548
-
549
-
550
-
551
-
552
-
553
-
554
-
555
-
556
-
557
-
558
-
559
-
560
-
561
-
562
-
563
-
564
 |
 |

Business review
124
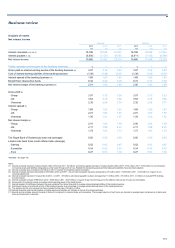
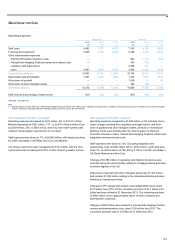
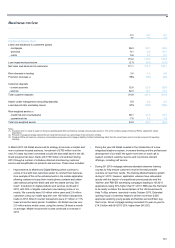
Operating expenses
Managed (1) Statutory
2013 2012* 2011* 2013 2012* 2011*
£m £m £m £m £m £m
Staff costs 6,882 7,377 8,072 7,163 8,188 8,562
Premises and equipment 2,233 2,096 2,246 2,348 2,232 2,423
Other administrative expenses
- Payment Protection Insurance costs —— — 900 1,110 850
- Interest Rate Hedging Products redress and related costs —— — 550 700 —
- regulatory and legal actions —— — 2,394 381 —
- other 2,947 2,899 2,922 3,400 3,402 3,586
A
dministrative expenses 12,062 12,372 13,240 16,755 16,013 15,421
Depreciation and amortisation 1,251 1,482 1,606 1,410 1,802 1,839
Write-down of goodwill —— — 1,059 18 80
Write-down of other intangible assets —— — 344 106 —
Operating expenses 13,313 13,854 14,846 19,568 17,939 17,340
Staff costs as a percentage of total income 35% 33% 34% 36% 46% 35%
*Restated - see page 102.
Note:
(1) Managed basis excludes PPI costs, Interest Rate Hedging Products redress and related costs, regulatory and legal actions, integration and restructuring costs, amortisation of purchased intangible
assets, write-down of goodwill and other intangible assets, bank levy, bonus tax and RFS MI.
2013 compared with 2012 - managed
Operating expenses decreased by £541 million, 4%, to £13,313 million.
Markets decreased by £327 million, 11%, to £2,610 million and Non-Core
by £339 million, 36%, to £605 million, driven by lower staff numbers and
reduced central support requirements on run-down.
Staff expenses were down by 7%, at £6,882 million, with headcount down
by 4,400, principally in UK Retail, Non-Core and Markets.
The Group cost:income ratio increased from 63% to 68%, with the Core
cost:income ratio increasing from 59% to 64%, driven by weaker income.
2013 compared with 2012 - statutory
Operating expenses increased by £1,629 million, or 9% primarily due to
higher charges resulting from regulatory and legal actions, and write-
down of goodwill and other intangible assets, primarily in International
Banking. These were partially offset by lower charges on Payment
Protection Insurance claims, Interest Rate Hedging Products redress and
integration and restructuring costs.
Staff expenses were down by 13%. Excluding integration and
restructuring costs of £280 million (2012 - £812 million), staff costs were
down 7%, as staff numbers (FTEs) fell by 4,100 to 118,400, principally in
UK Retail, Markets and Non-Core.
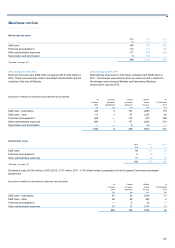
Charges of £2,394 million of regulatory and litigation provisions were
recorded during the year primarily relating to mortgage-backed and other
securities litigation in the US.
Write-down of goodwill and other intangible assets was £1,403 million
and includes £1,059 million relating to the International Banking division
following an impairment review.
Charges for PPI redress and related costs totalled £900 million, down
£210 million from 2012. Of the cumulative provision of £3.1 billion, £2.2
billion had been utilised at 31 December 2013. The remaining provision
of £900 million covers approximately twelve months of redress and
administrative expenses.
Charges of £550 million were booked for Interest Rate Hedging Product
redress and administration costs, down £150 million from 2012. The
cumulative provision was £1.25 billion at 31 December 2013.