RBS 2013 Annual Report Download - page 520
Download and view the complete annual report
Please find page 520 of the 2013 RBS annual report below. You can navigate through the pages in the report by either clicking on the pages listed below, or by using the keyword search tool below to find specific information within the annual report.-
 1
1 -
2
-
3
-
4
-
5
-
6
-
7
-
8
-
9
-
10
-
11
-
12
-
13
-
14
-
15
-
16
-
17
-
18
-
19
-
20
-
21
-
22
-
23
-
24
-
25
-
26
-
27
-
28
-
29
-
30
-
31
-
32
-
33
-
34
-
35
-
36
-
37
-
38
-
39
-
40
-
41
-
42
-
43
-
44
-
45
-
46
-
47
-
48
-
49
-
50
-
51
-
52
-
53
-
54
-
55
-
56
-
57
-
58
-
59
-
60
-
61
-
62
-
63
-
64
-
65
-
66
-
67
-
68
-
69
-
70
-
71
-
72
-
73
-
74
-
75
-
76
-
77
-
78
-
79
-
80
-
81
-
82
-
83
-
84
-
85
-
86
-
87
-
88
-
89
-
90
-
91
-
92
-
93
-
94
-
95
-
96
-
97
-
98
-
99
-
100
-
101
-
102
-
103
-
104
-
105
-
106
-
107
-
108
-
109
-
110
-
111
-
112
-
113
-
114
-
115
-
116
-
117
-
118
-
119
-
120
-
121
-
122
-
123
-
124
-
125
-
126
-
127
-
128
-
129
-
130
-
131
-
132
-
133
-
134
-
135
-
136
-
137
-
138
-
139
-
140
-
141
-
142
-
143
-
144
-
145
-
146
-
147
-
148
-
149
-
150
-
151
-
152
-
153
-
154
-
155
-
156
-
157
-
158
-
159
-
160
-
161
-
162
-
163
-
164
-
165
-
166
-
167
-
168
-
169
-
170
-
171
-
172
-
173
-
174
-
175
-
176
-
177
-
178
-
179
-
180
-
181
-
182
-
183
-
184
-
185
-
186
-
187
-
188
-
189
-
190
-
191
-
192
-
193
-
194
-
195
-
196
-
197
-
198
-
199
-
200
-
201
-
202
-
203
-
204
-
205
-
206
-
207
-
208
-
209
-
210
-
211
-
212
-
213
-
214
-
215
-
216
-
217
-
218
-
219
-
220
-
221
-
222
-
223
-
224
-
225
-
226
-
227
-
228
-
229
-
230
-
231
-
232
-
233
-
234
-
235
-
236
-
237
-
238
-
239
-
240
-
241
-
242
-
243
-
244
-
245
-
246
-
247
-
248
-
249
-
250
-
251
-
252
-
253
-
254
-
255
-
256
-
257
-
258
-
259
-
260
-
261
-
262
-
263
-
264
-
265
-
266
-
267
-
268
-
269
-
270
-
271
-
272
-
273
-
274
-
275
-
276
-
277
-
278
-
279
-
280
-
281
-
282
-
283
-
284
-
285
-
286
-
287
-
288
-
289
-
290
-
291
-
292
-
293
-
294
-
295
-
296
-
297
-
298
-
299
-
300
-
301
-
302
-
303
-
304
-
305
-
306
-
307
-
308
-
309
-
310
-
311
-
312
-
313
-
314
-
315
-
316
-
317
-
318
-
319
-
320
-
321
-
322
-
323
-
324
-
325
-
326
-
327
-
328
-
329
-
330
-
331
-
332
-
333
-
334
-
335
-
336
-
337
-
338
-
339
-
340
-
341
-
342
-
343
-
344
-
345
-
346
-
347
-
348
-
349
-
350
-
351
-
352
-
353
-
354
-
355
-
356
-
357
-
358
-
359
-
360
-
361
-
362
-
363
-
364
-
365
-
366
-
367
-
368
-
369
-
370
-
371
-
372
-
373
-
374
-
375
-
376
-
377
-
378
-
379
-
380
-
381
-
382
-
383
-
384
-
385
-
386
-
387
-
388
-
389
-
390
-
391
-
392
-
393
-
394
-
395
-
396
-
397
-
398
-
399
-
400
-
401
-
402
-
403
-
404
-
405
-
406
-
407
-
408
-
409
-
410
-
411
-
412
-
413
-
414
-
415
-
416
-
417
-
418
-
419
-
420
-
421
-
422
-
423
-
424
-
425
-
426
-
427
-
428
-
429
-
430
-
431
-
432
-
433
-
434
-
435
-
436
-
437
-
438
-
439
-
440
-
441
-
442
-
443
-
444
-
445
-
446
-
447
-
448
-
449
-
450
-
451
-
452
-
453
-
454
-
455
-
456
-
457
-
458
-
459
-
460
-
461
-
462
-
463
-
464
-
465
-
466
-
467
-
468
-
469
-
470
-
471
-
472
-
473
-
474
-
475
-
476
-
477
-
478
-
479
-
480
-
481
-
482
-
483
-
484
-
485
-
486
-
487
-
488
-
489
-
490
-
491
-
492
-
493
-
494
-
495
-
496
-
497
-
498
-
499
-
500
-
501
-
502
-
503
-
504
-
505
-
506
-
507
-
508
-
509
-
 510
510 -
 511
511 -
 512
512 -
 513
513 -
 514
514 -
 515
515 -
 516
516 -
 517
517 -
 518
518 -
 519
519 -
 520
520 -
 521
521 -
 522
522 -
 523
523 -
 524
524 -
 525
525 -
 526
526 -
 527
527 -
 528
528 -
 529
529 -
 530
530 -
531
-
532
-
533
-
534
-
535
-
536
-
537
-
538
-
539
-
540
-
541
-
542
-
543
-
544
-
545
-
546
-
547
-
548
-
549
-
550
-
551
-
552
-
553
-
554
-
555
-
556
-
557
-
558
-
559
-
560
-
561
-
562
-
563
-
564
 |
 |

Additional information
518
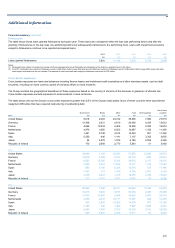
Financial summary continued
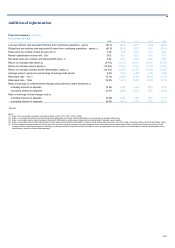
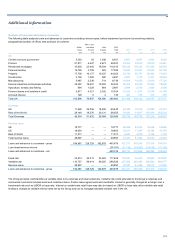
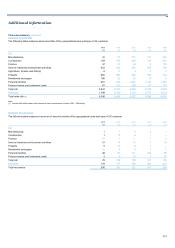
Certificates of deposit and other time deposits
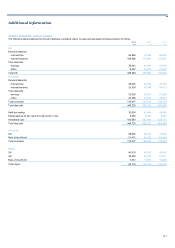
The following table shows details of the Group's certificates of deposit and other time deposits over $100,000 or equivalent by remaining maturity.
Over 3 Over 6
months months
Within but within but within Ove
r
3 months 6 months 12 months 12 months Total
2013 £m £m £m £m £m
UK based companies and branches
Certificates of deposit 671 39 537 65 1,312
Other time deposits 21,575 1,776 2,579 3,505 29,435
Overseas based companies and branches
Certificates of deposit 899 3 10 1 913
Other time deposits 8,427 2,337 1,760 1,252 13,776
31,572 4,155 4,886 4,823 45,436
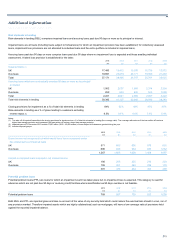
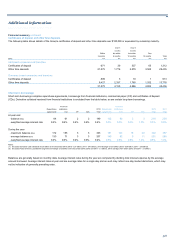
Short-term borrowings
Short-term borrowings comprise repurchase agreements, borrowings from financial institutions, commercial paper (CP) and certificates of deposit
(CDs). Derivative collateral received from financial institutions is excluded from the table below, as are certain long-term borrowings.
Financial Financial
Repurchase institutions 2013 Repurchase institutions 2012 2011
agreements (1,2) CP CDs Total agreements (1,2) CP CDs Total Total
A
t year end
- balance (£bn) 84 61 2 2 149 132 80 3 3 218 254
- weighted average interest rate 0.3% 0.6% 0.4% 0.6% 0.4% 0.5% 0.5% 0.3% 1.0% 0.5% 0.8%
During the year
- maximum balance (£bn) 172 155 3 3 333 181 103 18 20 322 357
- average balance (£bn) 130 71 3 3 207 149 82 9 11 251 288
- weighted average interest rate 0.3% 0.6% 0.4% 0.9% 0.4% 0.5% 0.6% 0.6% 1.2% 0.5% 1.0%
Notes:
(1) Excludes derivative cash collateral of £26 billion at 31 December 2013 (2012 - £37 billion; 2011 - £41 billion), 2013 average of £31 billion (2012 - £38 billion; 2011 - £35 billion).
(2) Excludes Federal Home Loan Bank’s long-term borrowings of £2 billion at 31 December 2013 (2012 and 2011 - £1 billion), 2013 average of £1 billion (2012 and 2011 - £1 billion).
Balances are generally based on monthly data. Average interest rates during the year are computed by dividing total interest expense by the average
amount borrowed. Average interest rates at year end are average rates for a single day and as such may reflect one-day market distortions, which may
not be indicative of generally prevailing rates.