RBS 2013 Annual Report Download - page 275
Download and view the complete annual report
Please find page 275 of the 2013 RBS annual report below. You can navigate through the pages in the report by either clicking on the pages listed below, or by using the keyword search tool below to find specific information within the annual report.-
 1
1 -
2
-
3
-
4
-
5
-
6
-
7
-
8
-
9
-
10
-
11
-
12
-
13
-
14
-
15
-
16
-
17
-
18
-
19
-
20
-
21
-
22
-
23
-
24
-
25
-
26
-
27
-
28
-
29
-
30
-
31
-
32
-
33
-
34
-
35
-
36
-
37
-
38
-
39
-
40
-
41
-
42
-
43
-
44
-
45
-
46
-
47
-
48
-
49
-
50
-
51
-
52
-
53
-
54
-
55
-
56
-
57
-
58
-
59
-
60
-
61
-
62
-
63
-
64
-
65
-
66
-
67
-
68
-
69
-
70
-
71
-
72
-
73
-
74
-
75
-
76
-
77
-
78
-
79
-
80
-
81
-
82
-
83
-
84
-
85
-
86
-
87
-
88
-
89
-
90
-
91
-
92
-
93
-
94
-
95
-
96
-
97
-
98
-
99
-
100
-
101
-
102
-
103
-
104
-
105
-
106
-
107
-
108
-
109
-
110
-
111
-
112
-
113
-
114
-
115
-
116
-
117
-
118
-
119
-
120
-
121
-
122
-
123
-
124
-
125
-
126
-
127
-
128
-
129
-
130
-
131
-
132
-
133
-
134
-
135
-
136
-
137
-
138
-
139
-
140
-
141
-
142
-
143
-
144
-
145
-
146
-
147
-
148
-
149
-
150
-
151
-
152
-
153
-
154
-
155
-
156
-
157
-
158
-
159
-
160
-
161
-
162
-
163
-
164
-
165
-
166
-
167
-
168
-
169
-
170
-
171
-
172
-
173
-
174
-
175
-
176
-
177
-
178
-
179
-
180
-
181
-
182
-
183
-
184
-
185
-
186
-
187
-
188
-
189
-
190
-
191
-
192
-
193
-
194
-
195
-
196
-
197
-
198
-
199
-
200
-
201
-
202
-
203
-
204
-
205
-
206
-
207
-
208
-
209
-
210
-
211
-
212
-
213
-
214
-
215
-
216
-
217
-
218
-
219
-
220
-
221
-
222
-
223
-
224
-
225
-
226
-
227
-
228
-
229
-
230
-
231
-
232
-
233
-
234
-
235
-
236
-
237
-
238
-
239
-
240
-
241
-
242
-
243
-
244
-
245
-
246
-
247
-
248
-
249
-
250
-
251
-
252
-
253
-
254
-
255
-
256
-
257
-
258
-
259
-
260
-
261
-
262
-
263
-
264
-
 265
265 -
 266
266 -
 267
267 -
 268
268 -
 269
269 -
 270
270 -
 271
271 -
 272
272 -
 273
273 -
 274
274 -
 275
275 -
 276
276 -
 277
277 -
 278
278 -
 279
279 -
 280
280 -
 281
281 -
 282
282 -
 283
283 -
 284
284 -
 285
285 -
286
-
287
-
288
-
289
-
290
-
291
-
292
-
293
-
294
-
295
-
296
-
297
-
298
-
299
-
300
-
301
-
302
-
303
-
304
-
305
-
306
-
307
-
308
-
309
-
310
-
311
-
312
-
313
-
314
-
315
-
316
-
317
-
318
-
319
-
320
-
321
-
322
-
323
-
324
-
325
-
326
-
327
-
328
-
329
-
330
-
331
-
332
-
333
-
334
-
335
-
336
-
337
-
338
-
339
-
340
-
341
-
342
-
343
-
344
-
345
-
346
-
347
-
348
-
349
-
350
-
351
-
352
-
353
-
354
-
355
-
356
-
357
-
358
-
359
-
360
-
361
-
362
-
363
-
364
-
365
-
366
-
367
-
368
-
369
-
370
-
371
-
372
-
373
-
374
-
375
-
376
-
377
-
378
-
379
-
380
-
381
-
382
-
383
-
384
-
385
-
386
-
387
-
388
-
389
-
390
-
391
-
392
-
393
-
394
-
395
-
396
-
397
-
398
-
399
-
400
-
401
-
402
-
403
-
404
-
405
-
406
-
407
-
408
-
409
-
410
-
411
-
412
-
413
-
414
-
415
-
416
-
417
-
418
-
419
-
420
-
421
-
422
-
423
-
424
-
425
-
426
-
427
-
428
-
429
-
430
-
431
-
432
-
433
-
434
-
435
-
436
-
437
-
438
-
439
-
440
-
441
-
442
-
443
-
444
-
445
-
446
-
447
-
448
-
449
-
450
-
451
-
452
-
453
-
454
-
455
-
456
-
457
-
458
-
459
-
460
-
461
-
462
-
463
-
464
-
465
-
466
-
467
-
468
-
469
-
470
-
471
-
472
-
473
-
474
-
475
-
476
-
477
-
478
-
479
-
480
-
481
-
482
-
483
-
484
-
485
-
486
-
487
-
488
-
489
-
490
-
491
-
492
-
493
-
494
-
495
-
496
-
497
-
498
-
499
-
500
-
501
-
502
-
503
-
504
-
505
-
506
-
507
-
508
-
509
-
510
-
511
-
512
-
513
-
514
-
515
-
516
-
517
-
518
-
519
-
520
-
521
-
522
-
523
-
524
-
525
-
526
-
527
-
528
-
529
-
530
-
531
-
532
-
533
-
534
-
535
-
536
-
537
-
538
-
539
-
540
-
541
-
542
-
543
-
544
-
545
-
546
-
547
-
548
-
549
-
550
-
551
-
552
-
553
-
554
-
555
-
556
-
557
-
558
-
559
-
560
-
561
-
562
-
563
-
564
 |
 |

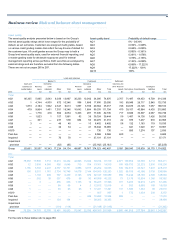
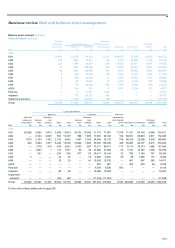
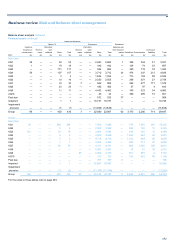
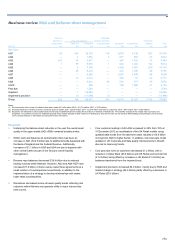
Business review Risk and balance sheet management
273
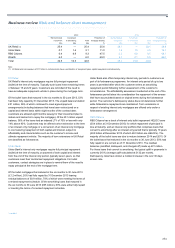
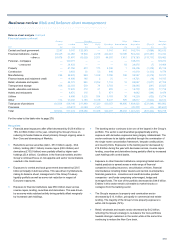
• Transport and storage exposure decreased by £1.1 billion. The
sector includes asset-backed exposures to ocean-going vessels.
Conditions remain poor across the major shipping market segments
in 2013 with low charter rates and vessel values. At 31 December
2013, £1.1 billion (2012 - £0.7 billion) of loans were included in risk
elements in lending with an associated provision of £0.4 billion and
impairment charge of £0.4 billion for 2013.
• Within lending:
° UK Retail unsecured lending decreased by £0.6 billion, partially
offset by an increase of £0.2 billion in mortgage lending.
° UK Corporate lending decreased by £4.5 billion, as business
demand for credit remains weak.
° Non-Core continued to make significant progress on its
balance sheet strategy by reducing lending by £19.8 billion
across all sectors, principally property and construction, where
commercial real estate lending decreased by £7.1 billion.
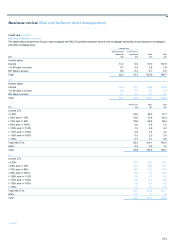
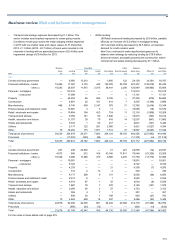
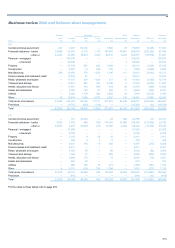
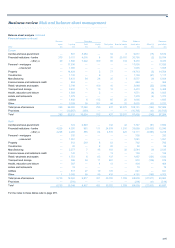
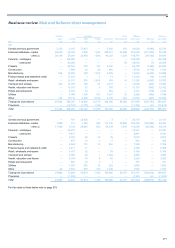
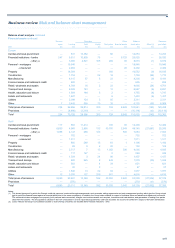
Reverse Securities Other Balance Exposure
repos Lending Debt Equity Derivatives financial assets sheet value Offset (1) post offset
2013 £m £m £m £m £m £m £m £m £m
UK
Central and local government — 6,950 13,210 — 3,856 122 24,138 (4,351) 19,787
Financial institutions - banks 18,462 17,597 3,153 449 132,076 55,720 227,457 (142,018) 85,439
- other (2) 19,293 28,937 11,915 2,015 56,441 2,248 120,849 (69,890) 50,959
Personal - mortgages — 110,515 — — — — 110,515 — 110,515
- unsecured — 17,098 — — — 3 17,101 — 17,101
Property — 44,252 86 292 2,728 — 47,358 (676) 46,682
Construction — 4,691 22 101 414 7 5,235 (1,346) 3,889
Manufacturing 466 8,740 409 2,147 979 21 12,762 (2,414) 10,348
Finance leases and instalment credit — 10,567 3 5 11 — 10,586 (16) 10,570
Retail, wholesale and repairs — 10,804 154 423 724 11 12,116 (1,908) 10,208
Transport and storage — 9,059 141 69 1,646 — 10,915 (703) 10,212
Health, education and leisure — 11,757 39 79 618 14 12,507 (847) 11,660
Hotels and restaurants — 5,333 1 50 217 — 5,601 (161) 5,440
Utilities — 2,117 123 281 2,900 — 5,421 (1,027) 4,394
Other 18 16,202 115 1,971 1,514 47 19,867 (2,625) 17,242
Total gross of provisions 38,239 304,619 29,371 7,882 204,124 58,193 642,428 (227,982) 414,446
Provisions — (11,005) (229) (82) — — (11,316) n/a (11,316)
Total 38,239 293,614 29,142 7,800 204,124 58,193 631,112 (227,982) 403,130
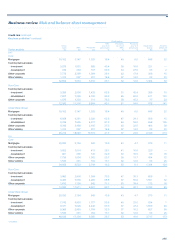
US
Central and local government 247 238 23,832 — 21 221 24,559 (12) 24,547
Financial institutions - banks 4,073 946 212 166 53,340 17,811 76,548 (53,339) 23,209
- other (2) 18,346 3,908 17,269 379 9,580 2,276 51,758 (13,778) 37,980
Personal - mortgages — 19,901 — — — — 19,901 — 19,901
- unsecured — 8,722 — — — — 8,722 — 8,722
Property — 4,279 — — 21 — 4,300 (7) 4,293
Construction — 313 2 13 2 — 330 — 330
Manufacturing — 6,117 299 9 131 — 6,556 (56) 6,500
Finance leases and instalment credit — 2,513 8 — 1 — 2,522 — 2,522
Retail, wholesale and repairs — 4,914 87 1 32 — 5,034 (6) 5,028
Transport and storage — 1,667 76 7 370 — 2,120 (141) 1,979
Health, education and leisure — 3,059 55 2 37 — 3,153 — 3,153
Hotels and restaurants — 369 4 7 1 — 381 — 381
Utilities — 638 32 1 149 — 820 (27) 793
Other 10 4,464 429 16 547 — 5,466 (20) 5,446
Total gross of provisions 22,676 62,048 42,305 601 64,232 20,308 212,170 (67,386) 144,784
Provisions — (850) (60) (12) — — (922) n/a (922)
Total 22,676 61,198 42,245 589 64,232 20,308 211,248 (67,386) 143,862
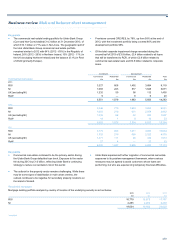
For the notes to these tables refer to page 278.