RBS 2013 Annual Report Download - page 515
Download and view the complete annual report
Please find page 515 of the 2013 RBS annual report below. You can navigate through the pages in the report by either clicking on the pages listed below, or by using the keyword search tool below to find specific information within the annual report.-
 1
1 -
2
-
3
-
4
-
5
-
6
-
7
-
8
-
9
-
10
-
11
-
12
-
13
-
14
-
15
-
16
-
17
-
18
-
19
-
20
-
21
-
22
-
23
-
24
-
25
-
26
-
27
-
28
-
29
-
30
-
31
-
32
-
33
-
34
-
35
-
36
-
37
-
38
-
39
-
40
-
41
-
42
-
43
-
44
-
45
-
46
-
47
-
48
-
49
-
50
-
51
-
52
-
53
-
54
-
55
-
56
-
57
-
58
-
59
-
60
-
61
-
62
-
63
-
64
-
65
-
66
-
67
-
68
-
69
-
70
-
71
-
72
-
73
-
74
-
75
-
76
-
77
-
78
-
79
-
80
-
81
-
82
-
83
-
84
-
85
-
86
-
87
-
88
-
89
-
90
-
91
-
92
-
93
-
94
-
95
-
96
-
97
-
98
-
99
-
100
-
101
-
102
-
103
-
104
-
105
-
106
-
107
-
108
-
109
-
110
-
111
-
112
-
113
-
114
-
115
-
116
-
117
-
118
-
119
-
120
-
121
-
122
-
123
-
124
-
125
-
126
-
127
-
128
-
129
-
130
-
131
-
132
-
133
-
134
-
135
-
136
-
137
-
138
-
139
-
140
-
141
-
142
-
143
-
144
-
145
-
146
-
147
-
148
-
149
-
150
-
151
-
152
-
153
-
154
-
155
-
156
-
157
-
158
-
159
-
160
-
161
-
162
-
163
-
164
-
165
-
166
-
167
-
168
-
169
-
170
-
171
-
172
-
173
-
174
-
175
-
176
-
177
-
178
-
179
-
180
-
181
-
182
-
183
-
184
-
185
-
186
-
187
-
188
-
189
-
190
-
191
-
192
-
193
-
194
-
195
-
196
-
197
-
198
-
199
-
200
-
201
-
202
-
203
-
204
-
205
-
206
-
207
-
208
-
209
-
210
-
211
-
212
-
213
-
214
-
215
-
216
-
217
-
218
-
219
-
220
-
221
-
222
-
223
-
224
-
225
-
226
-
227
-
228
-
229
-
230
-
231
-
232
-
233
-
234
-
235
-
236
-
237
-
238
-
239
-
240
-
241
-
242
-
243
-
244
-
245
-
246
-
247
-
248
-
249
-
250
-
251
-
252
-
253
-
254
-
255
-
256
-
257
-
258
-
259
-
260
-
261
-
262
-
263
-
264
-
265
-
266
-
267
-
268
-
269
-
270
-
271
-
272
-
273
-
274
-
275
-
276
-
277
-
278
-
279
-
280
-
281
-
282
-
283
-
284
-
285
-
286
-
287
-
288
-
289
-
290
-
291
-
292
-
293
-
294
-
295
-
296
-
297
-
298
-
299
-
300
-
301
-
302
-
303
-
304
-
305
-
306
-
307
-
308
-
309
-
310
-
311
-
312
-
313
-
314
-
315
-
316
-
317
-
318
-
319
-
320
-
321
-
322
-
323
-
324
-
325
-
326
-
327
-
328
-
329
-
330
-
331
-
332
-
333
-
334
-
335
-
336
-
337
-
338
-
339
-
340
-
341
-
342
-
343
-
344
-
345
-
346
-
347
-
348
-
349
-
350
-
351
-
352
-
353
-
354
-
355
-
356
-
357
-
358
-
359
-
360
-
361
-
362
-
363
-
364
-
365
-
366
-
367
-
368
-
369
-
370
-
371
-
372
-
373
-
374
-
375
-
376
-
377
-
378
-
379
-
380
-
381
-
382
-
383
-
384
-
385
-
386
-
387
-
388
-
389
-
390
-
391
-
392
-
393
-
394
-
395
-
396
-
397
-
398
-
399
-
400
-
401
-
402
-
403
-
404
-
405
-
406
-
407
-
408
-
409
-
410
-
411
-
412
-
413
-
414
-
415
-
416
-
417
-
418
-
419
-
420
-
421
-
422
-
423
-
424
-
425
-
426
-
427
-
428
-
429
-
430
-
431
-
432
-
433
-
434
-
435
-
436
-
437
-
438
-
439
-
440
-
441
-
442
-
443
-
444
-
445
-
446
-
447
-
448
-
449
-
450
-
451
-
452
-
453
-
454
-
455
-
456
-
457
-
458
-
459
-
460
-
461
-
462
-
463
-
464
-
465
-
466
-
467
-
468
-
469
-
470
-
471
-
472
-
473
-
474
-
475
-
476
-
477
-
478
-
479
-
480
-
481
-
482
-
483
-
484
-
485
-
486
-
487
-
488
-
489
-
490
-
491
-
492
-
493
-
494
-
495
-
496
-
497
-
498
-
499
-
500
-
501
-
502
-
503
-
504
-
 505
505 -
 506
506 -
 507
507 -
 508
508 -
 509
509 -
 510
510 -
 511
511 -
 512
512 -
 513
513 -
 514
514 -
 515
515 -
 516
516 -
 517
517 -
 518
518 -
 519
519 -
 520
520 -
 521
521 -
 522
522 -
 523
523 -
 524
524 -
 525
525 -
526
-
527
-
528
-
529
-
530
-
531
-
532
-
533
-
534
-
535
-
536
-
537
-
538
-
539
-
540
-
541
-
542
-
543
-
544
-
545
-
546
-
547
-
548
-
549
-
550
-
551
-
552
-
553
-
554
-
555
-
556
-
557
-
558
-
559
-
560
-
561
-
562
-
563
-
564
 |
 |

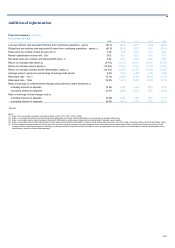
Additional information
513
2013 2012 2011 2010 2009
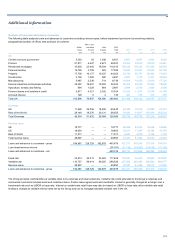
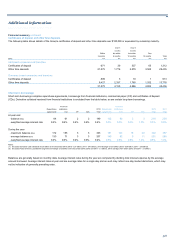
Closing customer provisions as a % of gross loans and advances to customers (3, 4)
UK 3.8% 3.1% 2.6% 2.5% 1.9%
Overseas 11.0% 8.2% 7.1% 5.3% 2.9%
Total 6.0% 4.7% 4.2% 3.5% 2.4%
Customer charge to income statement as a % of gross loans and advances to customers (3, 4)
UK 1.3% 0.8% 1.0% 1.1% 1.6%
Overseas 3.7% 2.1% 2.6% 2.9% 2.2%
Total 2.0% 1.2% 1.5% 1.8% 1.9%
Notes:
(1) Includes £15 million release relating to loans and advances to banks (2012 - £23 million charge; 2011 - nil; 2010 - £13 million release; 2009 - £34 million charge).
(2) Includes closing provisions against loans and advances to banks - see table below.
(3) Excludes reverse repos.
(4) For the purpose of these ratios, closing provisions and charge relating to loans and advances to banks are excluded.
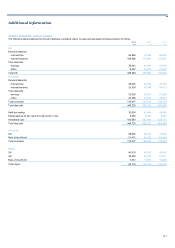
The following table shows additional information in respect of loan impairment provisions.
2013 2012 2011 2010 2009
£m £m £m £m £m
Loan impairment provisions at end of year
Customers 25,153 21,136 19,760 18,055 17,126
Banks 63 114 123 127 157
25,216 21,250 19,883 18,182 17,283
A
verage loans and advances to customers (gross) 509,937 541,588 578,057 610,131 821,155
A
s a % of average loans and advances to customers during the yea
r
Total customer provisions charged to income statement 1.6% 1.0% 1.3% 1.5% 1.6%
A
mounts written-off (net of recoveries) - customers 0.8% 0.7% 0.7% 0.9% 0.8%
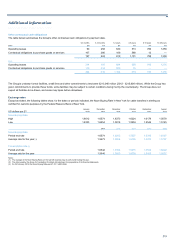
Analysis of closing customer loan impairment provisions
The following table analyses customer loan impairment provisions by geographical area and type of UK customer.
2013 2012 2011 2010 2009
% of loans % of loans % of loans % of loans % of loans
Closing to total Closing to total Closing to total Closing to total Closing to total
Provision Loans Provision Loans Provision Loans Provision Loans Provision Loans
£m % £m % £m %£m % £m %
UK
Central and local government 2 1.7 —1.8 — 1.7 — 1.1 — 0.7
Manufacturing 140 2.1 134 2.2 135 2.2 99 2.7 166 2.5
Construction 515 1.1 483 1.4 502 1.5 605 1.8 355 1.5
Finance 73 7.0 104 7.5 64 7.0 97 6.5 27 5.0
Service industries and
business activities 2,192 12.6 1,480 12.5 1,219 12.5 1,091 13.4 981 11.2
A
griculture, forestry and
fishing 45 0.7 34 0.6 36 0.6 26 0.6 19 0.4
Property 5,190 10.6 3,944 11.9 2,860 11.8 2,124 12.6 1,100 10.2
Residential mortgages 319 26.6 457 24.3 397 21.3 313 19.5 196 13.1
Personal lending 1,718 4.1 2,152 4.4 1,926 4.3 2,517 4.5 2,546 3.7
Finance leases and
instalment credit 136 2.5 184 2.3 367 2.4 436 2.6 340 2.3
A
ccrued interest — — —0.1 — 0.1 — 0.1 — 0.1
Total UK 10,330 69.0 8,972 69.0 7,506 65.4 7,308 65.4 5,730 50.7
Overseas 12,820 31.0 10,204 31.0 10,268 34.6 8,097 34.6 8,320 49.3
Impaired book provisions 23,150 100.0 19,176 100.0 17,774 100.0 15,405 100.0 14,050 100.0
Latent book provisions 2,003 1,960 1,986 2,650 3,076
Total provisions 25,153 21,136 19,760 18,055 17,126