RBS 2013 Annual Report Download - page 169
Download and view the complete annual report
Please find page 169 of the 2013 RBS annual report below. You can navigate through the pages in the report by either clicking on the pages listed below, or by using the keyword search tool below to find specific information within the annual report.-
 1
1 -
2
-
3
-
4
-
5
-
6
-
7
-
8
-
9
-
10
-
11
-
12
-
13
-
14
-
15
-
16
-
17
-
18
-
19
-
20
-
21
-
22
-
23
-
24
-
25
-
26
-
27
-
28
-
29
-
30
-
31
-
32
-
33
-
34
-
35
-
36
-
37
-
38
-
39
-
40
-
41
-
42
-
43
-
44
-
45
-
46
-
47
-
48
-
49
-
50
-
51
-
52
-
53
-
54
-
55
-
56
-
57
-
58
-
59
-
60
-
61
-
62
-
63
-
64
-
65
-
66
-
67
-
68
-
69
-
70
-
71
-
72
-
73
-
74
-
75
-
76
-
77
-
78
-
79
-
80
-
81
-
82
-
83
-
84
-
85
-
86
-
87
-
88
-
89
-
90
-
91
-
92
-
93
-
94
-
95
-
96
-
97
-
98
-
99
-
100
-
101
-
102
-
103
-
104
-
105
-
106
-
107
-
108
-
109
-
110
-
111
-
112
-
113
-
114
-
115
-
116
-
117
-
118
-
119
-
120
-
121
-
122
-
123
-
124
-
125
-
126
-
127
-
128
-
129
-
130
-
131
-
132
-
133
-
134
-
135
-
136
-
137
-
138
-
139
-
140
-
141
-
142
-
143
-
144
-
145
-
146
-
147
-
148
-
149
-
150
-
151
-
152
-
153
-
154
-
155
-
156
-
157
-
158
-
 159
159 -
 160
160 -
 161
161 -
 162
162 -
 163
163 -
 164
164 -
 165
165 -
 166
166 -
 167
167 -
 168
168 -
 169
169 -
 170
170 -
 171
171 -
 172
172 -
 173
173 -
 174
174 -
 175
175 -
 176
176 -
 177
177 -
 178
178 -
 179
179 -
180
-
181
-
182
-
183
-
184
-
185
-
186
-
187
-
188
-
189
-
190
-
191
-
192
-
193
-
194
-
195
-
196
-
197
-
198
-
199
-
200
-
201
-
202
-
203
-
204
-
205
-
206
-
207
-
208
-
209
-
210
-
211
-
212
-
213
-
214
-
215
-
216
-
217
-
218
-
219
-
220
-
221
-
222
-
223
-
224
-
225
-
226
-
227
-
228
-
229
-
230
-
231
-
232
-
233
-
234
-
235
-
236
-
237
-
238
-
239
-
240
-
241
-
242
-
243
-
244
-
245
-
246
-
247
-
248
-
249
-
250
-
251
-
252
-
253
-
254
-
255
-
256
-
257
-
258
-
259
-
260
-
261
-
262
-
263
-
264
-
265
-
266
-
267
-
268
-
269
-
270
-
271
-
272
-
273
-
274
-
275
-
276
-
277
-
278
-
279
-
280
-
281
-
282
-
283
-
284
-
285
-
286
-
287
-
288
-
289
-
290
-
291
-
292
-
293
-
294
-
295
-
296
-
297
-
298
-
299
-
300
-
301
-
302
-
303
-
304
-
305
-
306
-
307
-
308
-
309
-
310
-
311
-
312
-
313
-
314
-
315
-
316
-
317
-
318
-
319
-
320
-
321
-
322
-
323
-
324
-
325
-
326
-
327
-
328
-
329
-
330
-
331
-
332
-
333
-
334
-
335
-
336
-
337
-
338
-
339
-
340
-
341
-
342
-
343
-
344
-
345
-
346
-
347
-
348
-
349
-
350
-
351
-
352
-
353
-
354
-
355
-
356
-
357
-
358
-
359
-
360
-
361
-
362
-
363
-
364
-
365
-
366
-
367
-
368
-
369
-
370
-
371
-
372
-
373
-
374
-
375
-
376
-
377
-
378
-
379
-
380
-
381
-
382
-
383
-
384
-
385
-
386
-
387
-
388
-
389
-
390
-
391
-
392
-
393
-
394
-
395
-
396
-
397
-
398
-
399
-
400
-
401
-
402
-
403
-
404
-
405
-
406
-
407
-
408
-
409
-
410
-
411
-
412
-
413
-
414
-
415
-
416
-
417
-
418
-
419
-
420
-
421
-
422
-
423
-
424
-
425
-
426
-
427
-
428
-
429
-
430
-
431
-
432
-
433
-
434
-
435
-
436
-
437
-
438
-
439
-
440
-
441
-
442
-
443
-
444
-
445
-
446
-
447
-
448
-
449
-
450
-
451
-
452
-
453
-
454
-
455
-
456
-
457
-
458
-
459
-
460
-
461
-
462
-
463
-
464
-
465
-
466
-
467
-
468
-
469
-
470
-
471
-
472
-
473
-
474
-
475
-
476
-
477
-
478
-
479
-
480
-
481
-
482
-
483
-
484
-
485
-
486
-
487
-
488
-
489
-
490
-
491
-
492
-
493
-
494
-
495
-
496
-
497
-
498
-
499
-
500
-
501
-
502
-
503
-
504
-
505
-
506
-
507
-
508
-
509
-
510
-
511
-
512
-
513
-
514
-
515
-
516
-
517
-
518
-
519
-
520
-
521
-
522
-
523
-
524
-
525
-
526
-
527
-
528
-
529
-
530
-
531
-
532
-
533
-
534
-
535
-
536
-
537
-
538
-
539
-
540
-
541
-
542
-
543
-
544
-
545
-
546
-
547
-
548
-
549
-
550
-
551
-
552
-
553
-
554
-
555
-
556
-
557
-
558
-
559
-
560
-
561
-
562
-
563
-
564
 |
 |

Business review
167
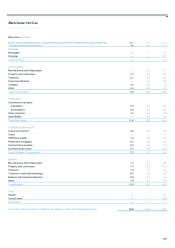
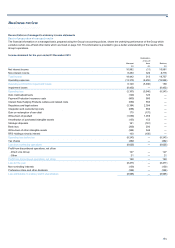
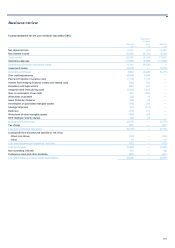
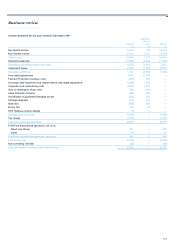
Cash flow 2013 2012* 2011*
£m £m £m
Net cash flows from operating activities (30,631) (45,113) 3,325
Net cash flows from investing activities 21,183 27,175 14
Net cash flows from financing activities (2,728) 2,017 (1,741)
Effects of exchange rate changes on cash and cash equivalents 512 (3,893) (1,473)
Net (decrease)/increase in cash and cash equivalents (11,664) (19,814) 125
*Restated - see page 102.
2013
The major factors contributing to the net cash outflow from operating
activities of £30,631 million were the decrease of £28,780 million in
operating assets and liabilities, the net operating loss before tax of
£8,066 million from continuing and discontinued operations, loans and
advances written-off net of recoveries of £4,090 million and other
provisions utilised of £2,066 million. These were partially offset by
provisions for impairment losses of £8,432 million and other provisions
charged net of releases £4,422 million.
Net cash inflows from investing activities of £21,183 million related to the
net inflows from sales of securities of £19,211 million, the sale of
property, plant and equipment of £1,448 million and net divestments of
business interests and intangible assets of £1,150 million offset by net
cash outflows from the purchase of property, plant and equipment of
£626 million.
Net cash outflows from financing activities of £2,728 million relate
primarily to the repayment of subordinated liabilities of £3,500 million and
interest paid on subordinated liabilities of £958 million partly offset by the
issue of subordinated liabilities of £1,796 million.
2012
The major factors contributing to the net cash outflow from operating
activities of £45,113 million were the decrease of £48,736 million in
operating assets and liabilities, the net operating loss before tax of
£5,388 million from continuing and discontinued operations, loans and
advances written off net of recoveries of £3,925 million and other non-
cash items of £1,491 million. These were partially offset by the
elimination of foreign exchange differences of £7,140 million, provisions
for impairment losses of £5,283 million and depreciation and amortisation
of £1,854 million.
Net cash inflows from investing activities of £27,175 million related to the
net inflows from sales of securities of £26,092 million, the sale of
property, plant and equipment of £2,215 million and divestments in
business interests and intangible assets of £352 million offset by net cash
outflows from the purchase of property, plant and equipment of £1,484
million.
Net cash inflows from financing activities of £2,017 million relate primarily
to the issue of subordinated liabilities of £2,093 million and proceeds of
non-controlling interests issued of £889 million partly offset by interest
paid on subordinated liabilities of £746 million and dividends paid of £301
million.
2011
The major factors contributing to the net cash inflow from operating
activities of £3,325 million were the elimination of foreign exchange
differences of £2,702 million, depreciation and amortisation of £1,875
million and inflow from other items of £3,106 million, partially offset by the
net operating loss before tax of £914 million from continuing and
discontinued operations and the decrease of £3,444 million in operating
assets and liabilities.
Net cash inflows from investing activities of £14 million related to the net
inflows from sales of securities of £3,074 million, and sale of property,
plant and equipment of £1,840 million offset by net cash outflows from
investments in business interests and intangible assets of £1,428 million
and from the purchase of property, plant and equipment of £3,472 million.
Net cash outflows from financing activities of £1,741 million relate
primarily to interest on subordinated liabilities of £714 million, repayment
of subordinated liabilities of £627 million and redemption of non-
controlling interests of £382 million.