RBS 2013 Annual Report Download - page 236
Download and view the complete annual report
Please find page 236 of the 2013 RBS annual report below. You can navigate through the pages in the report by either clicking on the pages listed below, or by using the keyword search tool below to find specific information within the annual report.-
 1
1 -
2
-
3
-
4
-
5
-
6
-
7
-
8
-
9
-
10
-
11
-
12
-
13
-
14
-
15
-
16
-
17
-
18
-
19
-
20
-
21
-
22
-
23
-
24
-
25
-
26
-
27
-
28
-
29
-
30
-
31
-
32
-
33
-
34
-
35
-
36
-
37
-
38
-
39
-
40
-
41
-
42
-
43
-
44
-
45
-
46
-
47
-
48
-
49
-
50
-
51
-
52
-
53
-
54
-
55
-
56
-
57
-
58
-
59
-
60
-
61
-
62
-
63
-
64
-
65
-
66
-
67
-
68
-
69
-
70
-
71
-
72
-
73
-
74
-
75
-
76
-
77
-
78
-
79
-
80
-
81
-
82
-
83
-
84
-
85
-
86
-
87
-
88
-
89
-
90
-
91
-
92
-
93
-
94
-
95
-
96
-
97
-
98
-
99
-
100
-
101
-
102
-
103
-
104
-
105
-
106
-
107
-
108
-
109
-
110
-
111
-
112
-
113
-
114
-
115
-
116
-
117
-
118
-
119
-
120
-
121
-
122
-
123
-
124
-
125
-
126
-
127
-
128
-
129
-
130
-
131
-
132
-
133
-
134
-
135
-
136
-
137
-
138
-
139
-
140
-
141
-
142
-
143
-
144
-
145
-
146
-
147
-
148
-
149
-
150
-
151
-
152
-
153
-
154
-
155
-
156
-
157
-
158
-
159
-
160
-
161
-
162
-
163
-
164
-
165
-
166
-
167
-
168
-
169
-
170
-
171
-
172
-
173
-
174
-
175
-
176
-
177
-
178
-
179
-
180
-
181
-
182
-
183
-
184
-
185
-
186
-
187
-
188
-
189
-
190
-
191
-
192
-
193
-
194
-
195
-
196
-
197
-
198
-
199
-
200
-
201
-
202
-
203
-
204
-
205
-
206
-
207
-
208
-
209
-
210
-
211
-
212
-
213
-
214
-
215
-
216
-
217
-
218
-
219
-
220
-
221
-
222
-
223
-
224
-
225
-
 226
226 -
 227
227 -
 228
228 -
 229
229 -
 230
230 -
 231
231 -
 232
232 -
 233
233 -
 234
234 -
 235
235 -
 236
236 -
 237
237 -
 238
238 -
 239
239 -
 240
240 -
 241
241 -
 242
242 -
 243
243 -
 244
244 -
 245
245 -
 246
246 -
247
-
248
-
249
-
250
-
251
-
252
-
253
-
254
-
255
-
256
-
257
-
258
-
259
-
260
-
261
-
262
-
263
-
264
-
265
-
266
-
267
-
268
-
269
-
270
-
271
-
272
-
273
-
274
-
275
-
276
-
277
-
278
-
279
-
280
-
281
-
282
-
283
-
284
-
285
-
286
-
287
-
288
-
289
-
290
-
291
-
292
-
293
-
294
-
295
-
296
-
297
-
298
-
299
-
300
-
301
-
302
-
303
-
304
-
305
-
306
-
307
-
308
-
309
-
310
-
311
-
312
-
313
-
314
-
315
-
316
-
317
-
318
-
319
-
320
-
321
-
322
-
323
-
324
-
325
-
326
-
327
-
328
-
329
-
330
-
331
-
332
-
333
-
334
-
335
-
336
-
337
-
338
-
339
-
340
-
341
-
342
-
343
-
344
-
345
-
346
-
347
-
348
-
349
-
350
-
351
-
352
-
353
-
354
-
355
-
356
-
357
-
358
-
359
-
360
-
361
-
362
-
363
-
364
-
365
-
366
-
367
-
368
-
369
-
370
-
371
-
372
-
373
-
374
-
375
-
376
-
377
-
378
-
379
-
380
-
381
-
382
-
383
-
384
-
385
-
386
-
387
-
388
-
389
-
390
-
391
-
392
-
393
-
394
-
395
-
396
-
397
-
398
-
399
-
400
-
401
-
402
-
403
-
404
-
405
-
406
-
407
-
408
-
409
-
410
-
411
-
412
-
413
-
414
-
415
-
416
-
417
-
418
-
419
-
420
-
421
-
422
-
423
-
424
-
425
-
426
-
427
-
428
-
429
-
430
-
431
-
432
-
433
-
434
-
435
-
436
-
437
-
438
-
439
-
440
-
441
-
442
-
443
-
444
-
445
-
446
-
447
-
448
-
449
-
450
-
451
-
452
-
453
-
454
-
455
-
456
-
457
-
458
-
459
-
460
-
461
-
462
-
463
-
464
-
465
-
466
-
467
-
468
-
469
-
470
-
471
-
472
-
473
-
474
-
475
-
476
-
477
-
478
-
479
-
480
-
481
-
482
-
483
-
484
-
485
-
486
-
487
-
488
-
489
-
490
-
491
-
492
-
493
-
494
-
495
-
496
-
497
-
498
-
499
-
500
-
501
-
502
-
503
-
504
-
505
-
506
-
507
-
508
-
509
-
510
-
511
-
512
-
513
-
514
-
515
-
516
-
517
-
518
-
519
-
520
-
521
-
522
-
523
-
524
-
525
-
526
-
527
-
528
-
529
-
530
-
531
-
532
-
533
-
534
-
535
-
536
-
537
-
538
-
539
-
540
-
541
-
542
-
543
-
544
-
545
-
546
-
547
-
548
-
549
-
550
-
551
-
552
-
553
-
554
-
555
-
556
-
557
-
558
-
559
-
560
-
561
-
562
-
563
-
564
 |
 |

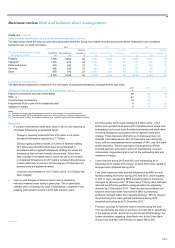
Business review Risk and balance sheet management
234
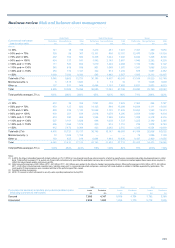
Credit risk continued
Credit risk assets* continued
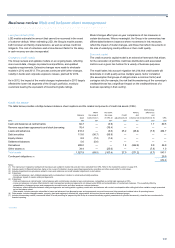
Key points
Financial markets and the Group’s focus on risk appetite and sector
concentration had a direct impact on the portfolio during the year with the
following key trends observed:
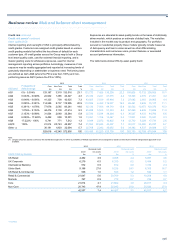
• Total CRA fell 8%, with the only notable increase being in the
sovereign sector, including exposures to central banks (increased
3%). Excluding sovereign exposures, CRA decreased by 10%.
• At the year end, the portfolio comprised 31% personal exposure
(2012 - 29%), sovereign 15% (2012 - 13%) exposure to banks and
other financial institutions 16% (2012 - 18%), property 13% (2012 -
14%), and other corporate sectors 25% (2012 - 26%).
• CRA fell in all geographic regions. The largest decrease, in Western
Europe, was primarily a result of reduced exposures to European
central banks.
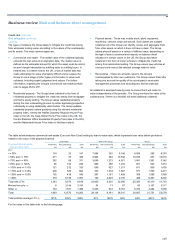
• UK exposure increased to 56% of CRA (2012 - 51%) because of a
£16.2 billion rise in exposure to the Bank of England. This was offset
predominantly by falls in Non-Core property (£7.5 billion) and Core
personal and banking sectors, which fell £4.3 billion in total.
Excluding sovereigns, UK Core exposure fell by 3%).
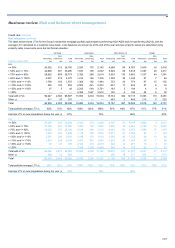
• The personal sector, excluding exposures in North America, fell by
2% due to reduced overdraft and lending exposure in the UK. This
was offset by slightly increased UK mortgage exposure. Personal
exposure in North America decreased disproportionately due to
Non-Core exposures.
• Exposure to sovereigns fluctuates according to Group liquidity
requirements and cash positions. These are driven by inflows and
outflows of deposits which determine the level of cash placed with
central banks and have contributed to higher exposures at the Bank
of England and lower exposures at European central banks. The
Group’s sovereign portfolio comprises exposures to central
governments, central banks and sub-sovereigns such as local
authorities, primarily in the Group’s key markets of the UK, Western
Europe and the US. The asset quality is high because exposures
are largely short-term cash balances placed with central banks such
as the Bank of England, the Federal Reserve and the Eurosystem
(including the European Central Bank and central banks in the
eurozone). Information on the Group’s exposure to governments,
including peripheral eurozone sovereigns, can be found in the
Country risk section.
• Exposure to the banking sector is well diversified geographically.
Limits and exposures are tightly controlled through the combination
of the SNC framework, bespoke credit policies and country limits.
Derivatives generated the largest exposure for banks (58% of credit
risk assets in the banks sector), but a large portion of the exposures
was collateralised. The increase in bank exposure in the Asia Pacific
region was largely driven by short-term, trade finance related
activities.
*unaudited
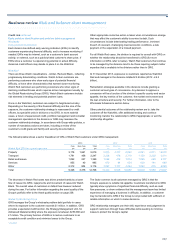
• Exposure to banks and financial institutions declined by 20%. This
was primarily as a result of limited lending and interbank money
market activity which fell by 8% and a reduction in derivative
exposures which fell by 27%. The declining trend in interbank
activity was largely attributable to increased bank liquidity including
access to liquidity via schemes put in place via central banks and
governments. The reduction in derivative exposure was due to the
Group exiting certain products and the benefits of regulatory netting
derived from the implementation of new modelling methodology. The
Group has a suite of control frameworks and policies for managing
the derivatives portfolio, particularly uncollateralised derivatives with
long tenors. During the year the control framework for this segment
of the portfolio was further tightened.
• Exposure to other financial institutions comprises a range of
financial companies, the largest of which were funds (25%)
securitisation vehicles (22%) and financial intermediaries (16%)
including broker dealers and central counterparties (CCPs). The
Core other financial institutions portfolio decreased by 8% in 2013.
The Non-Core portfolio decreased by 31%.
• At the year end, the total exposure to CCPs was £4.1 billion (2012 -
£3.2 billion). Regulatory initiatives to encourage the wider use of
CCPs for clearing over-the-counter derivatives across the industry
continue. The Group supports this move but recognises that its
concentration risk to CCPs will continue to rise when it clears its own
trades, as well as when it acts as a clearing broker for third
parties. This increased concentration risk is being managed under a
specific risk appetite and control framework. The Group’s CCP
exposure remains dominated by a small number of well-established,
high quality and reputable clearing houses.
• The Group continued to manage down its exposures to financial
guarantors - credit derivative products companies (CDPCs) and
monolines with a view to exiting these portfolios. Exposure to
financial guarantors declined by 69% and represented less than 1%
of the other financial institutions portfolio (2012 - 2%). Exposures
have decreased materially over time as trades are commuted and
exposures reduced due to the tightening credit spread of the assets
protected by CDPCs and monolines. At the year end, exposures to
CDPCs and monolines totalled £274 million (2012 - £874 million).
• The majority of the Group’s property exposure was commercial real
estate in Ireland and the UK (refer to Commercial real estate on
pages 252 to 257 for further details). The remainder comprised
lending to construction companies and building materials groups,
which fell by £1.7 billion (15%), and housing associations, which
increased by £0.9 billion (12%). A total of 59% of the Group’s Core
property exposure was in UK Corporate (2012 - 60%) with Ulster
Bank and US Retail & Commercial representing 10% and 9%
respectively, unchanged from 2012.